System-Level Simulation & Subsystem Interaction CAE Analysis
APJ 3D delivers multi-fidelity system level simulation services across India. We model emergent engineering behavior by combining 1D transient performance tools with 3D spatial CAE, helping automotive and industrial engineering teams predict full system response before physical prototypes are built.
Multi-Fidelity System Engineering
We orchestrate models across the complexity spectrum, coupling high-speed 1D models with high-fidelity 3D CAE domains to manage computational costs without losing spatial precision.
Component CAE vs. System-Level Simulation
Component simulation answers whether a part can withstand defined loads. System simulation predicts whether the entire assembly works together in the real world.

What System Level Simulation Covers
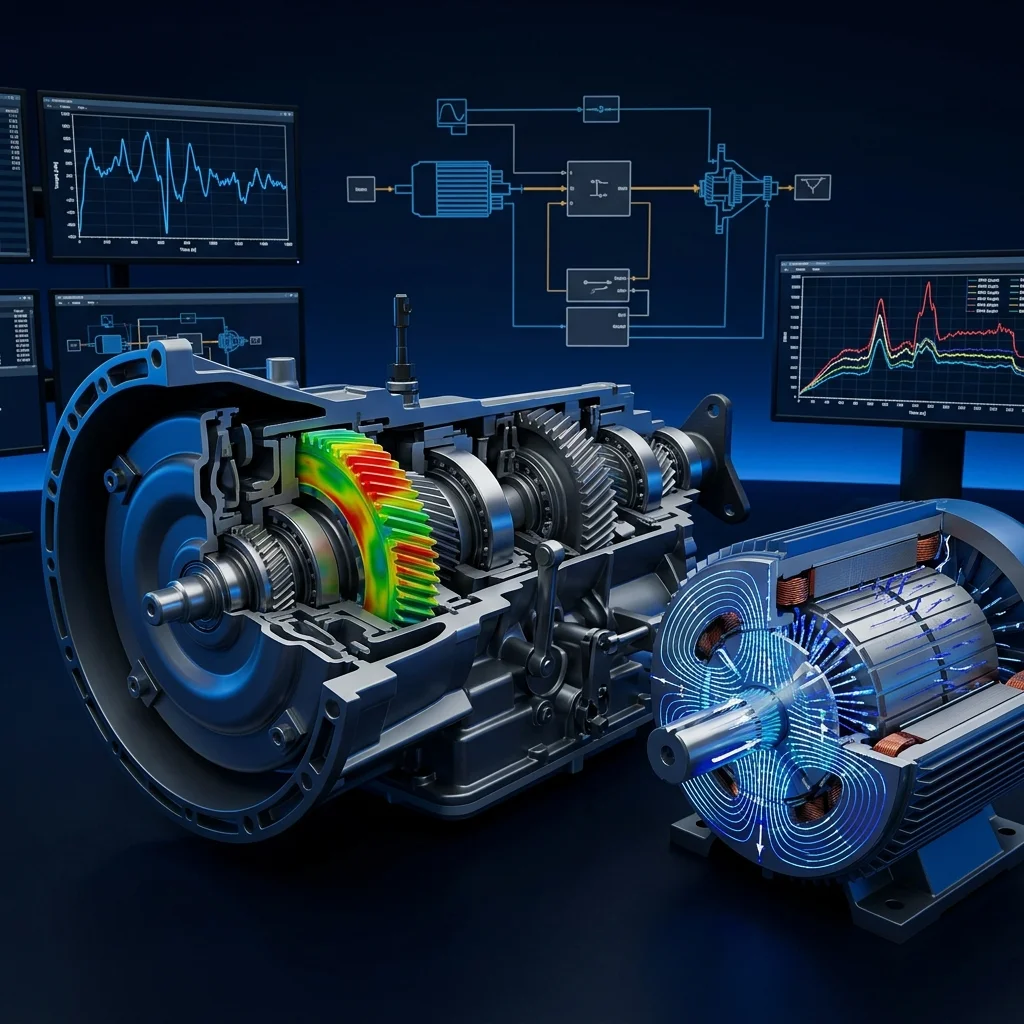
We cover four fundamental engineering domains with coupled, multi-fidelity model integration.
Powertrain & Drivetrain Simulation
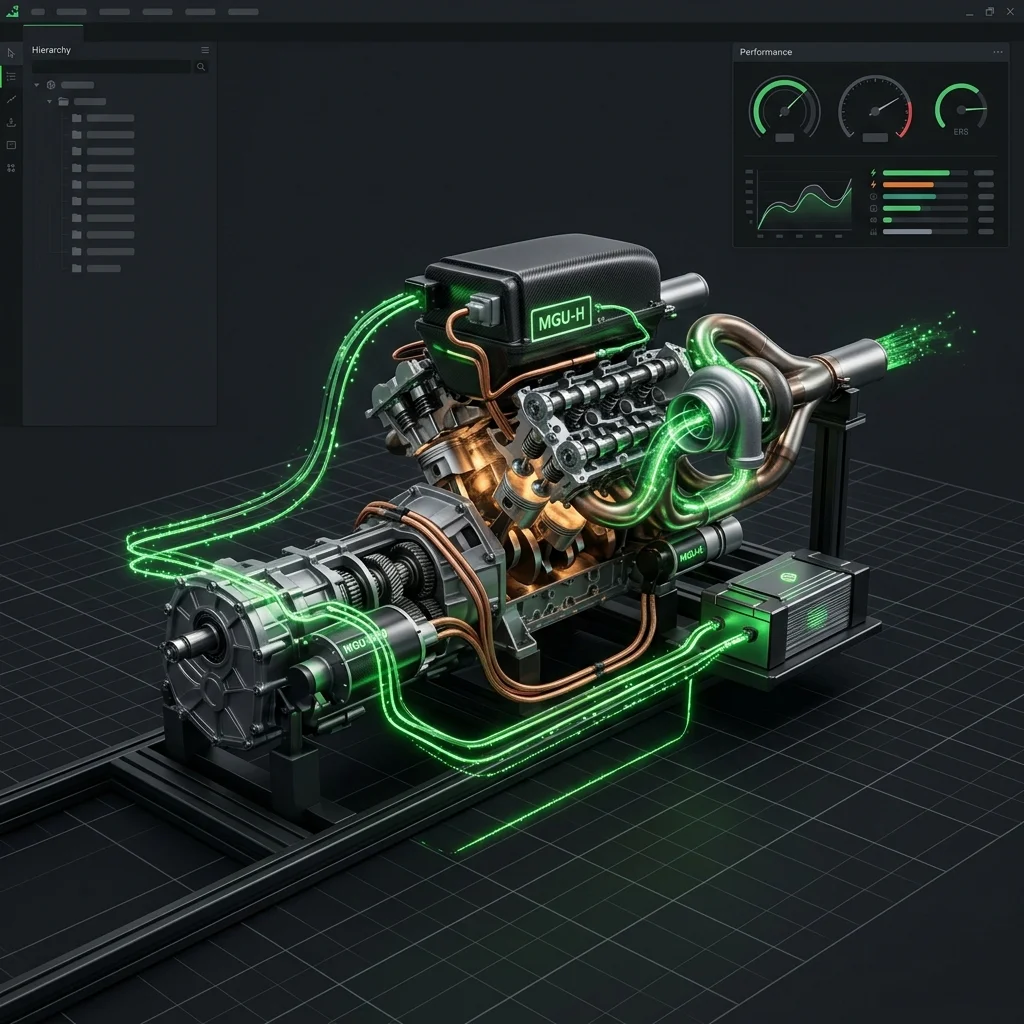
Predict fuel consumption, powertrain loading, and acceleration metrics under real operating cycles. APJ 3D models the dynamic interaction between engine/motor performance, automatic or manual transmission gear transitions, and total driveline resistance.
Thermal Management Simulation
Model coolant circuits, heat exchangers, and air flow paths simultaneously. By coupling 1D network solvers with high-fidelity 3D CFD stream analyses, we isolate structural and fluid heat paths accurately without wasting computation hours.
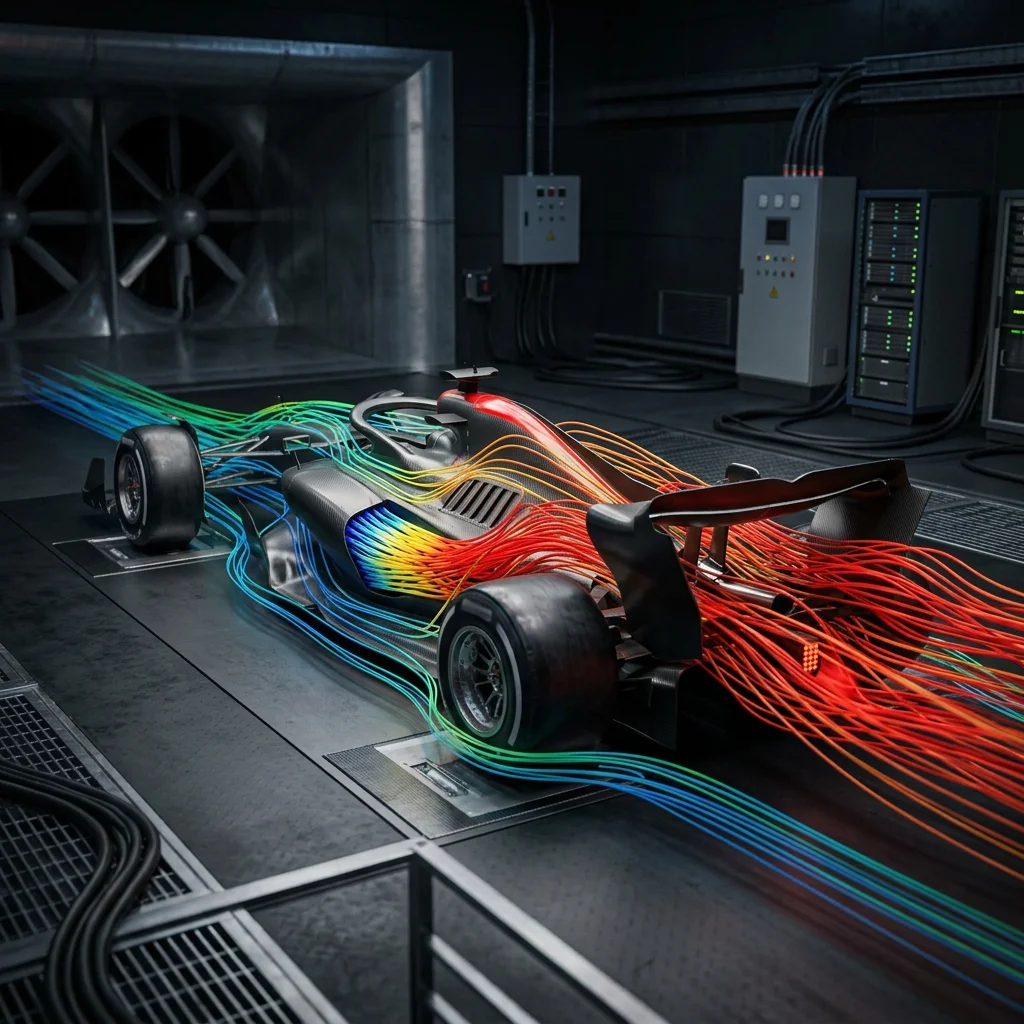

EV Battery Thermal-Electrical System
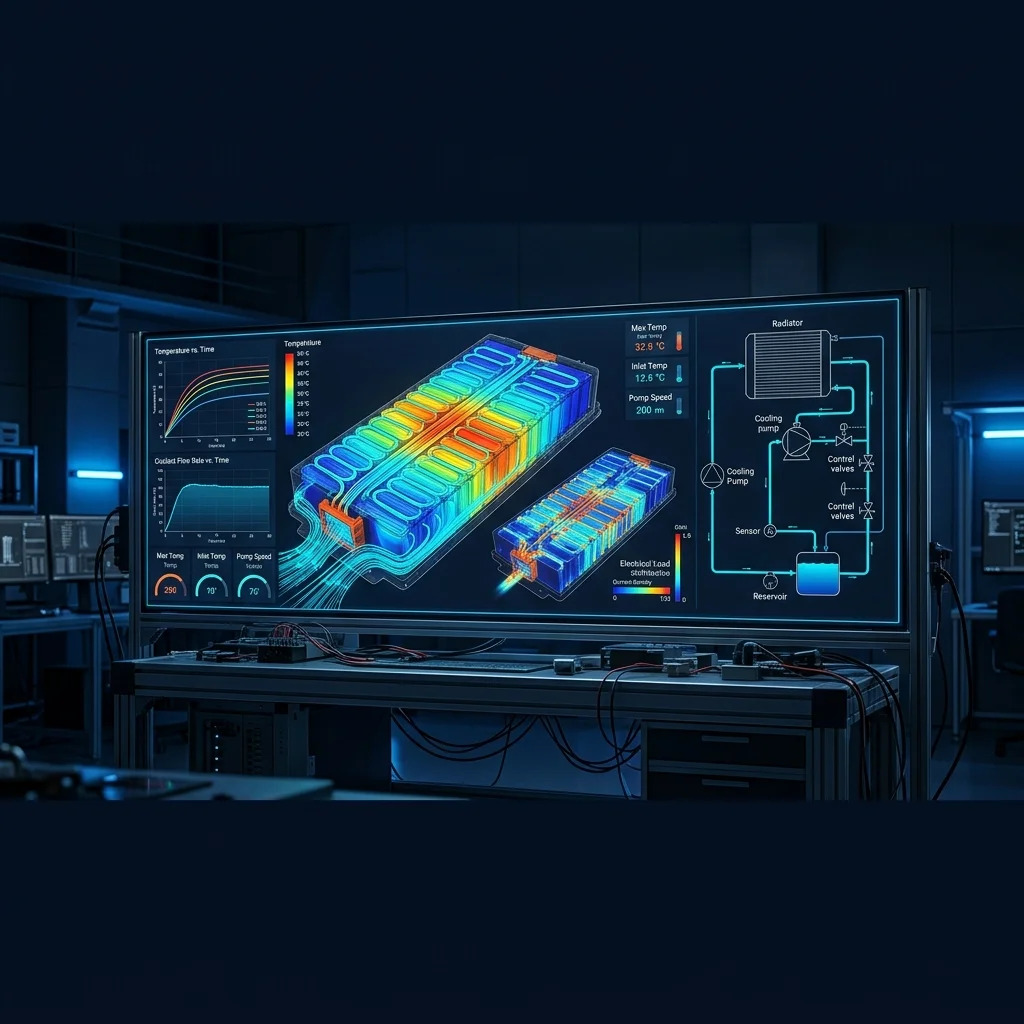
Analyze battery pack degradation, range parameters, and cell temperatures under fast charging cycles. Real-time integration captures cell voltage drop co-dependences with heat-rejection circuits.
Chassis & Mechatronics Interaction
Incorporate suspension dynamics, active steering systems, and hydraulic brake lines into feedback loop algorithms. This provides true transient control inputs for full vehicle maneuvering tests.
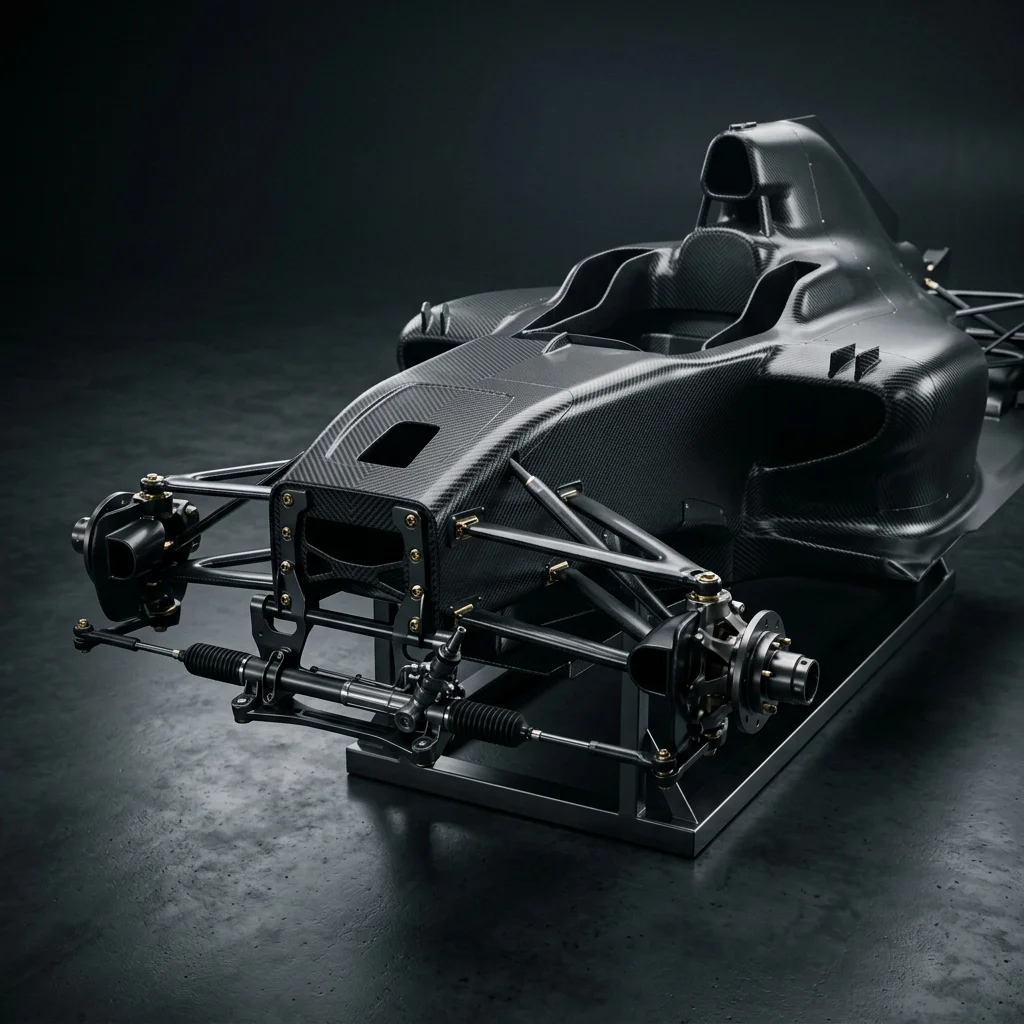
Recent Automotive R&D Engagement
Simulation Identified a Critical Thermal Bottleneck Before Prototype Build.
APJ 3D partnered with a Tier-1 automotive OEM to conduct multi-domain validation of a next-generation EV battery pack cooling circuit. By coupling high-fidelity 3D spatial CFD with transient 1D electrical load profiles, our team isolated fluid-structure heat transfer coefficients to diagnose high-speed charging constraints before physical tooling.
Delivery Process Roadmap
APJ 3D orchestrates simulation data flowing through an active, interconnected systems engineering decision pipeline.
System Level Simulation Deliverables
We provide complete decision-ready datasets alongside professional, structured reports.
Full boundary mapping, solver parameters, and coordinate interfaces documented.
Measured correlation coefficients confirming simulation accuracy vs. component tests.
Transient variables monitored over dynamic highway and urban test profiles.
High-resolution fluid heat paths and component coupling parameters visualized.
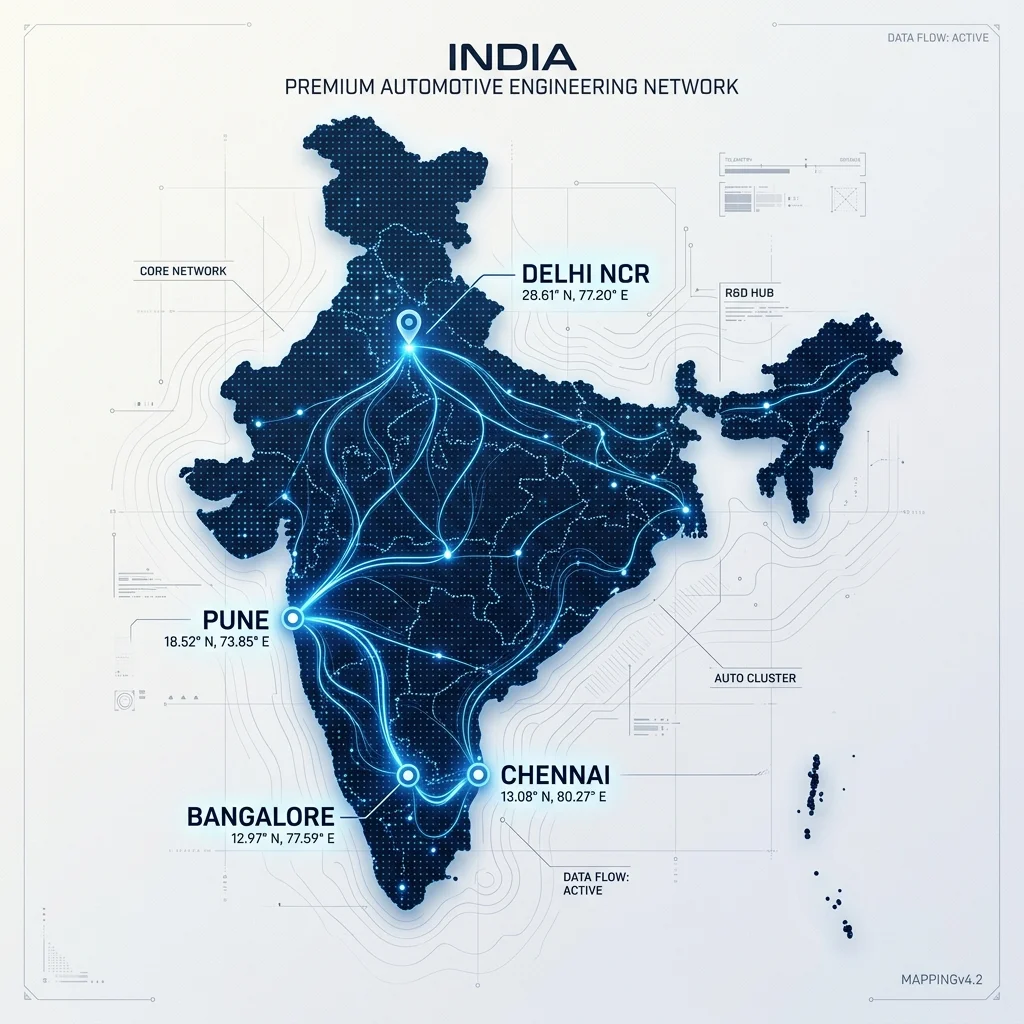
On-Site Support Pan India
APJ 3D validates system models against physical variables right where your testbeds are. Our engineers deploy on-site to resolve interface boundary questions quickly across India's largest automotive clusters.
What is System Level Simulation Services India?
System-level simulation is a multi-fidelity CAE method that models emergent behavior across interacting subsystems by combining 1D transient performance tools with 3D spatial simulation, capturing how mechanical, thermal, fluid, and control subsystems influence one another's response.
When to Select This Service
Choose system-level simulation when isolated single-component analysis cannot capture cross-subsystem interaction, and you need to predict full system response before physical prototypes are built.
Technical Capabilities & Verification Standards
Verified engineering parameters, hardware precision, and compliance benchmarks applied across all deliverables.
| Engineering Parameter | APJ 3D Capability & Precision Range | Compliance Standard / Verification |
|---|---|---|
| Simulation Approach | Multi-fidelity modeling combining 1D transient performance tools with 3D spatial CAE to capture emergent system behavior | Multi-Fidelity System Engineering |
| Domain Coverage | Powertrain & drivetrain, thermal management, EV battery thermal-electrical, and chassis & mechatronics interaction | Coupled Multi-Fidelity Models |
| Analysis Scope | Captures subsystem dependencies and interactions beyond isolated component-level CAE assumptions | System-Level Simulation |
| Validation Method | Simulation results correlated against physical component test data with measured correlation coefficients | Validation Correlation Charts |
| Drive Cycle Testing | Transient variables monitored across dynamic highway and urban drive-cycle test profiles | Drive Cycle Response Graphs |
| Deliverables | Simulation architecture reports with full boundary mapping, solver parameters, and coordinate interfaces | Decision-Ready Datasets |
| Engineering Support | On-site support for automotive and industrial engineering teams across India | On-Site Support Pan India |