Controlling Manufacturing Variation
Before Production Begins
A CAD model can be perfect and still fail in production. Our Tolerance Stack-Up Analysis Services and Dimensional Tolerance Stack Analysis identify variation accumulation, fitment risk, and assembly failures before a single part is manufactured.
The Hidden Cost of Tolerance Build-Up
A CAD model can be dimensionally perfect and still fail in production. One tolerance affects the next. Then the next. Then the whole assembly goes out of spec.
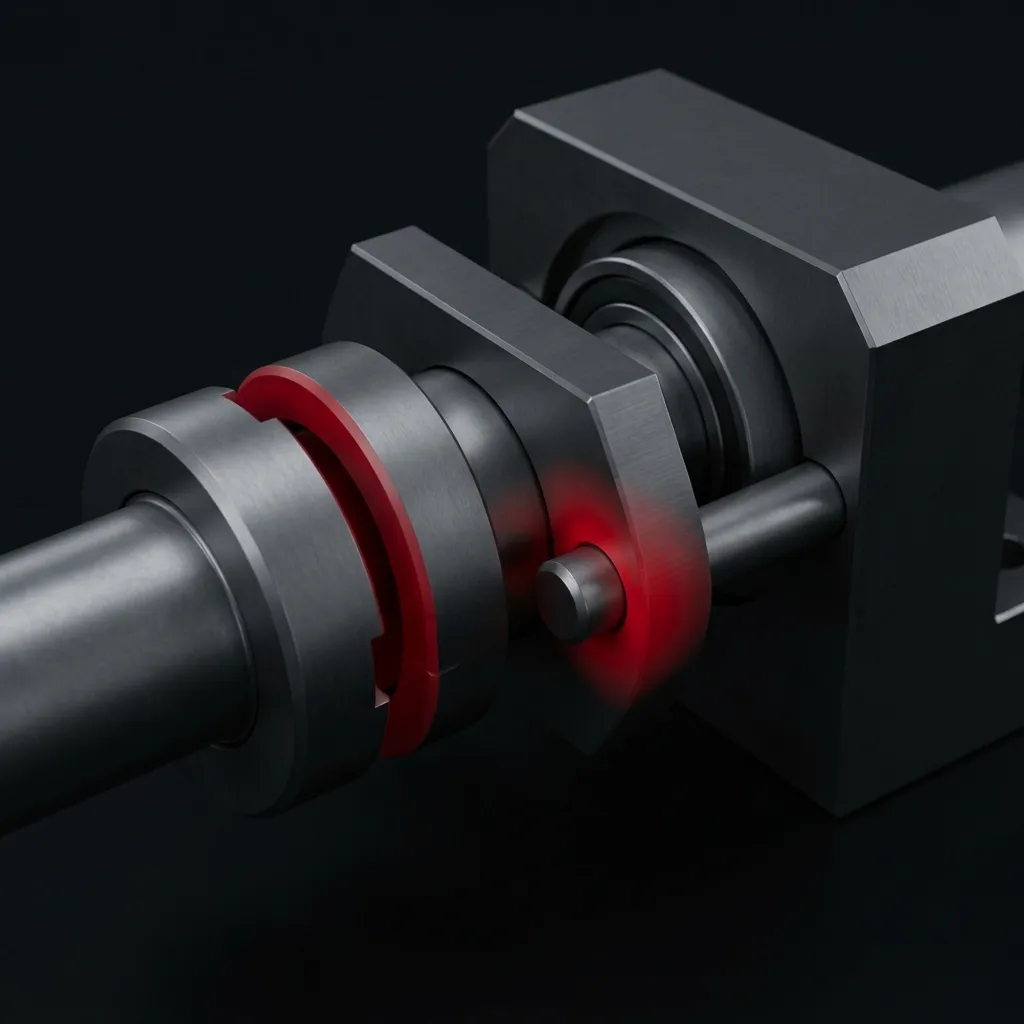
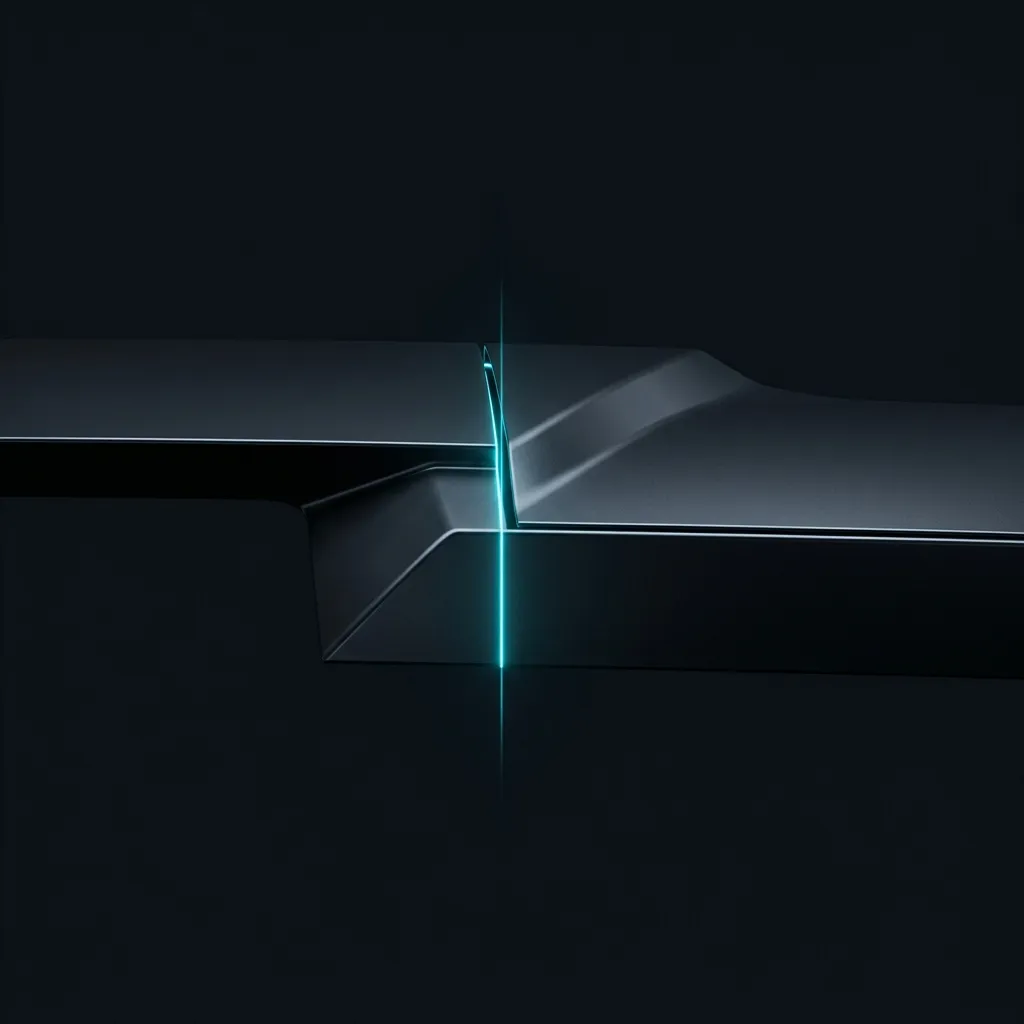
Housing
Bracket
Shaft
Bearing
Misalignment
Tolerance Stack-Up Simulator
Toggle between Worst Case and RSS methods. Watch accumulated variation update live. Dimensional Tolerance Stack Analysis made visual.
Tolerance Chain Investigation Lab
Scan critical assembly interfaces to reveal datum influence and variation sources. Tolerance Chain Analysis Outsourcing powered by forensic engineering logic.
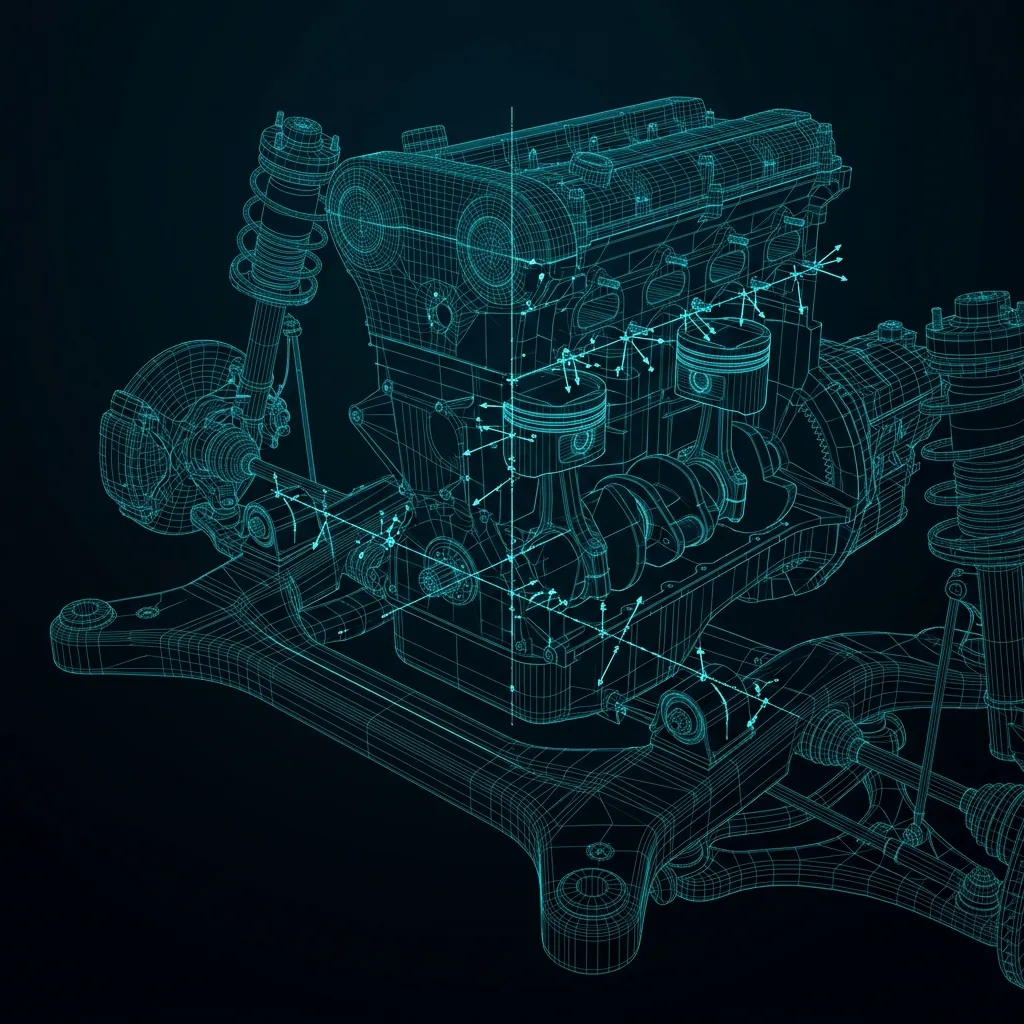
Flatness ±0.02
GD&T to Functional Performance
Every GD&T callout connects to a manufacturing outcome. Every manufacturing outcome connects to inspection. Inspection connects to assembly. Assembly connects to product performance.
Callout
turing
Plan
Fitment
Performance
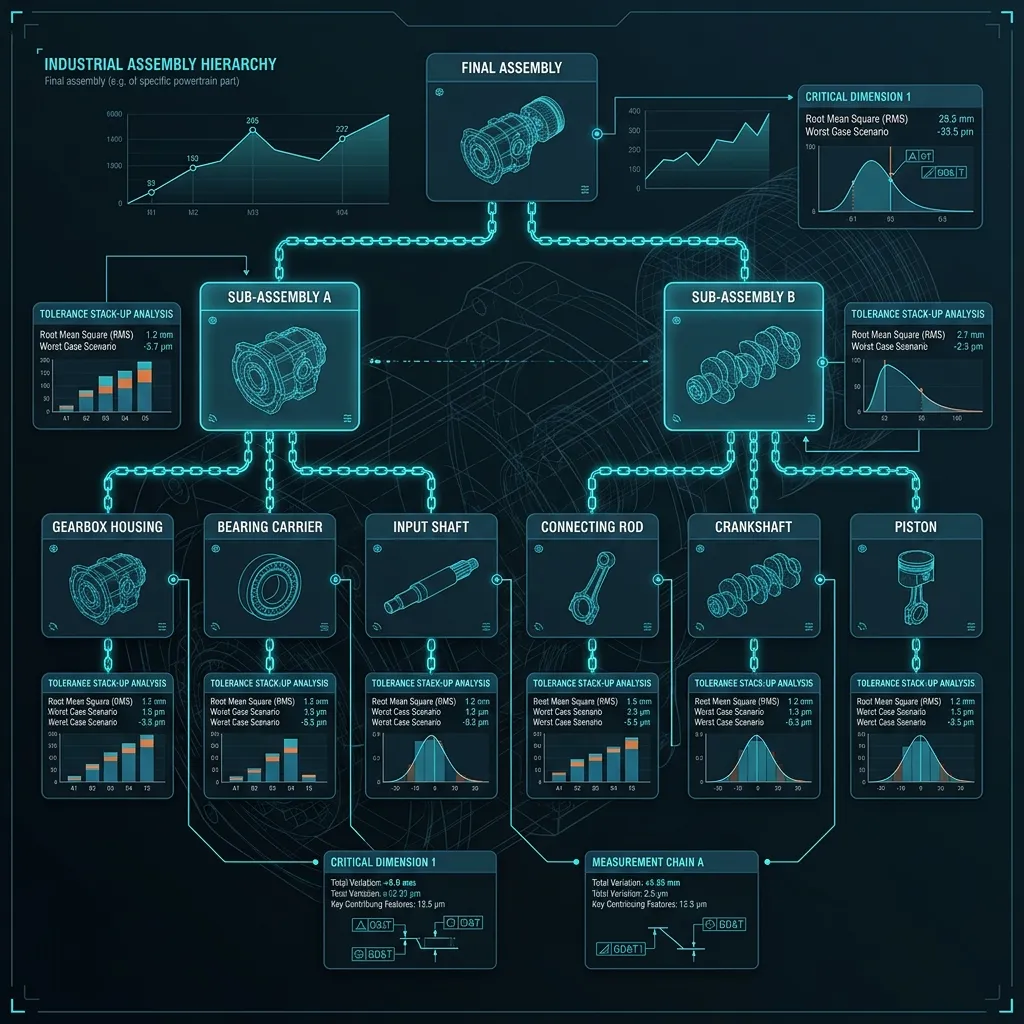
Assembly Variation Control Center
Tolerance budget visible at component, sub-assembly, and final assembly level. Assembly Tolerance Study Services that map variation across the entire build hierarchy.
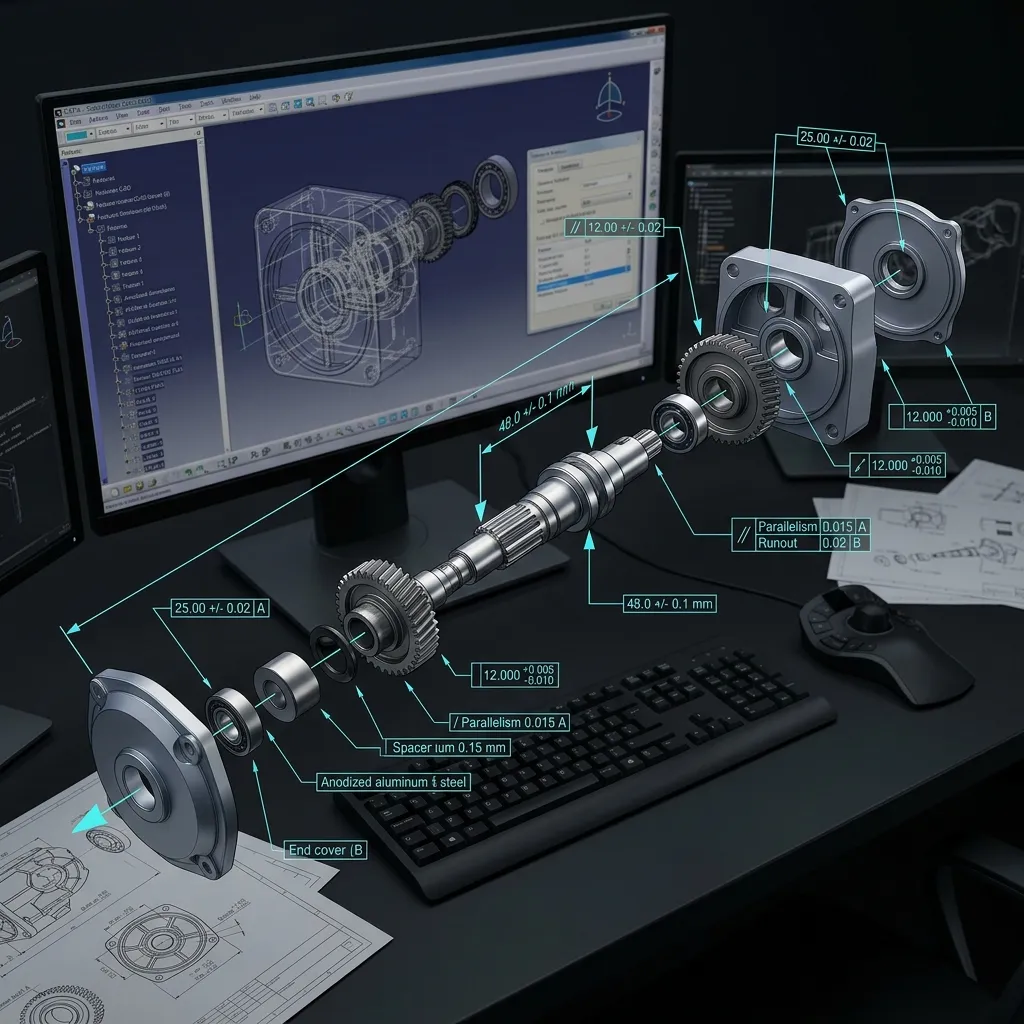
Real Engineering Case Study
Automotive sub-assembly — before and after APJ 3D Tolerance Stack-Up Analysis and GD&T optimisation.
What is Tolerance Stack-Up Analysis Services India?
Tolerance stack-up analysis is a dimensional engineering method that mathematically combines individual part and assembly tolerances, using Worst Case and RSS (Root Sum Square) analysis, to predict variation accumulation, fitment risk, and assembly failures directly from a CAD model.
When to Select This Service
Choose tolerance stack-up analysis when a CAD model looks correct on screen but assembly fit and function risk must be verified before a single part is manufactured.
Technical Capabilities & Verification Standards
Verified engineering parameters, hardware precision, and compliance benchmarks applied across all deliverables.
| Engineering Parameter | APJ 3D Capability & Precision Range | Compliance Standard / Verification |
|---|---|---|
| Stack-Up Methods | Worst Case Analysis and Root Sum Square (RSS) statistical tolerance stack-up modeling | Worst Case & RSS Analysis |
| GD&T Review | Geometric Dimensioning & Tolerancing callout review linking design intent to manufacturing outcome | GD&T Tolerance Review |
| Assembly Variation Control | Identification of variation accumulation and fitment risk across multi-part assembly chains | Assembly Variation Control Center |
| Stack Simulation | Interactive tolerance stack-up simulation modeling before a single part is manufactured | Tolerance Stack-Up Simulator |
| GD&T to Performance Traceability | Tracing each GD&T callout through manufacturing, inspection, assembly, and final product performance | GD&T to Functional Performance |
| Service Timing | Performed before drawing release to validate variation ahead of production commitment | Pre-Release Variation Validation |
Frequently Asked Questions
Can you perform 3D scanning on-site at our manufacturing plant?
Can you perform 3D scanning on-site at our manufacturing plant?
How do 3D scanning and reverse engineering differ?
How do 3D scanning and reverse engineering differ?
What is a color deviation inspection map?
What is a color deviation inspection map?
Can dark, shiny, or transparent surfaces be scanned?
Can dark, shiny, or transparent surfaces be scanned?
What accuracy can we expect for automotive and aerospace components?
What accuracy can we expect for automotive and aerospace components?
Before You Release the Drawing, Validate the Variation
Expert Tolerance Stack-Up Analysis Services across India. From Dimensional Tolerance Stack Analysis and Worst Case studies to RSS statistical analysis and full GD&T Tolerance Review — APJ 3D ensures your assembly fits, functions, and ships without rework.