At 300 km/h, Engineering Decisions Cannot Be Made by Guesswork
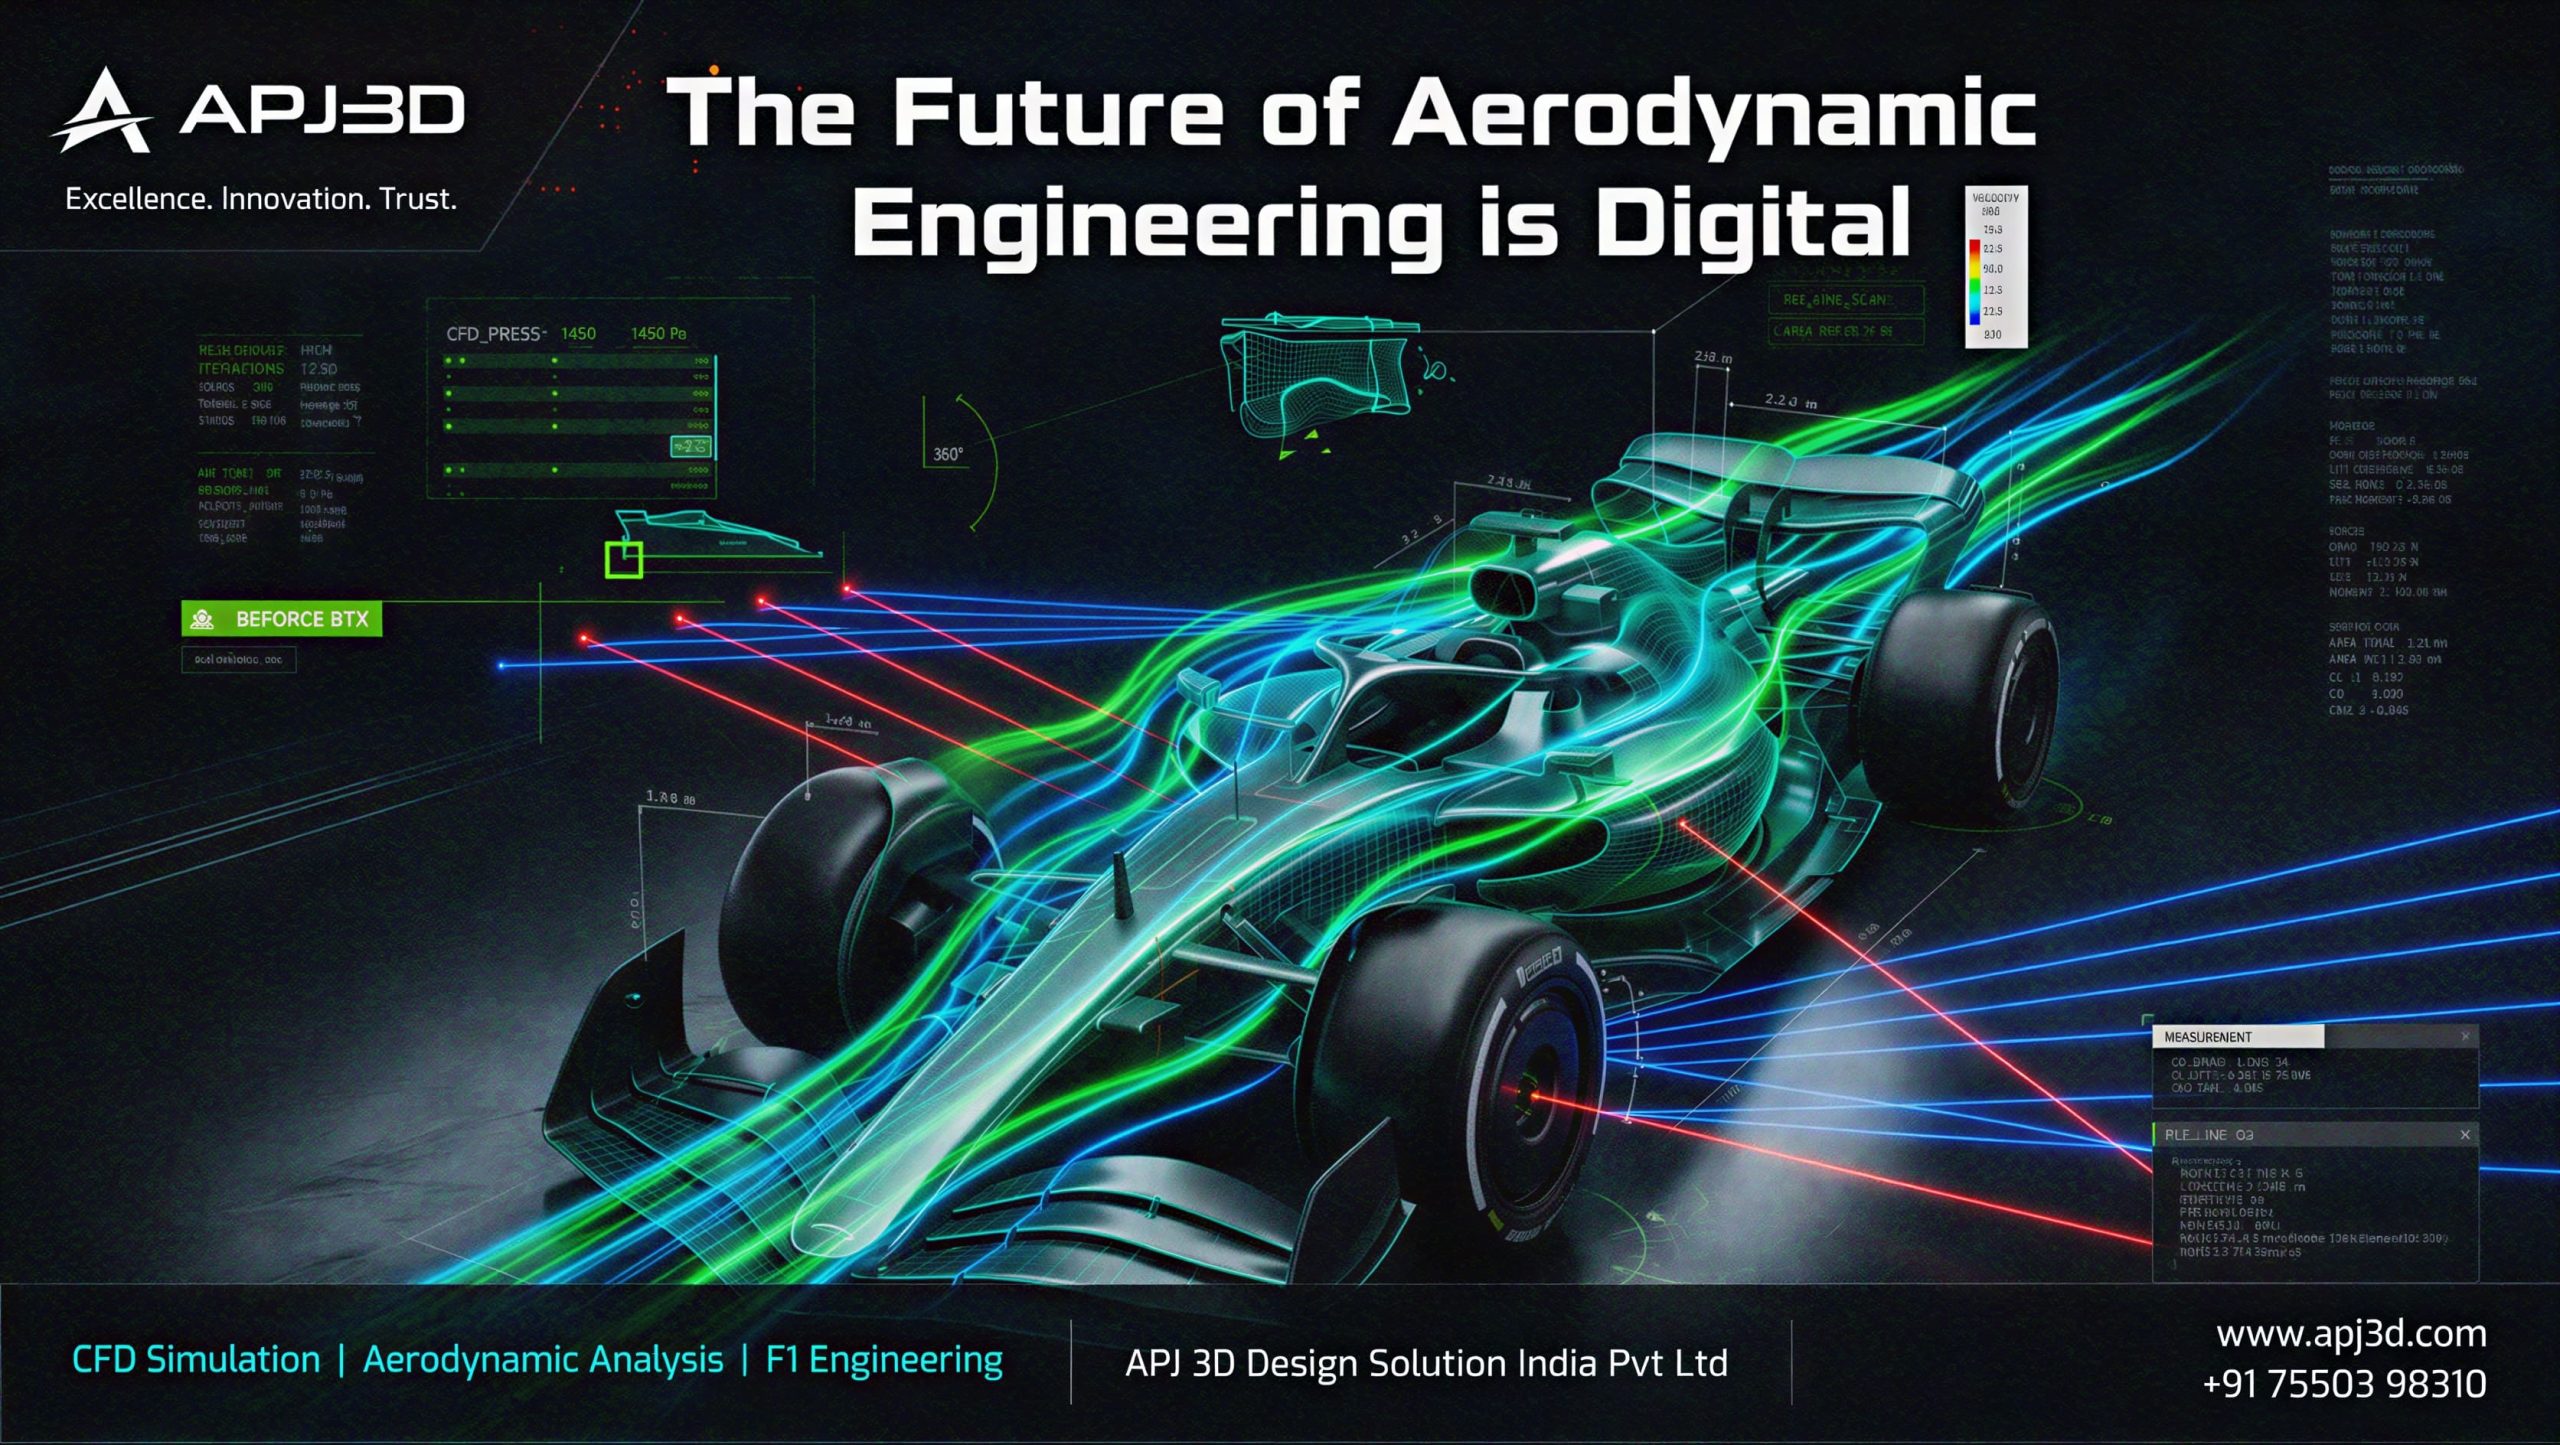
Every surface on an F1 car exists for one reason — to manage airflow. The difference between a front wing that generates 32% of total downforce and one that generates 28% is invisible to the human eye. It only shows up in data. Getting that data used to mean wind tunnels, physical models, and weeks of testing. Today it means CAE — Computer-Aided Engineering — and specifically CFD simulation using ANSYS Fluent.
This is not about replacing engineering judgement. It is about giving engineers the data to exercise that judgement accurately, before a single part is manufactured.
What CAE Actually Involves — The Workflow Behind the Visualisation
CAE is a workflow, not a button. Every stage requires specific engineering decisions. Miss one and the result is unreliable — regardless of how good the visualisation looks.
Geometry Preparation
The CAD model needs to be clean, watertight, and free of surface defects before meshing begins. Gaps, overlapping surfaces, and irrelevant internal detail all compromise mesh quality and solver stability. This is unglamorous work — but without it, the simulation does not produce reliable results.
Computational Domain and Boundary Conditions
The car sits inside a virtual wind tunnel — a defined domain representing the surrounding air volume. Boundary conditions tell the solver what is happening at every face of that domain. Inlet velocity: 83.3 m/s (300 km/h). Outlet: atmospheric pressure. Ground wall: moving boundary replicating the road surface beneath the car. Getting the ground boundary condition right matters — a stationary floor produces incorrect underbody flow and unreliable diffuser performance data.
Mesh Generation
The domain is divided into discrete cells — 47.3 million in this analysis. Each cell is a location where flow equations are solved. Mesh density is concentrated where aerodynamic activity is highest — front wing, underbody channel, rear wing wake, tyre zones. First cell height from wall surfaces is set to achieve y+ values appropriate for the turbulence model. Mesh quality — skewness, orthogonality, aspect ratio — is checked before the solver runs. Poor mesh quality produces numerical diffusion that smears the flow features the simulation is trying to resolve.
Solver Configuration
ANSYS Fluent 2024 R1 was used with the k-epsilon Realizable turbulence model — appropriate for the separated flows, strong curvature, and recirculating wake structures that dominate F1 aerodynamics. SIMPLEC pressure-velocity coupling with second-order upwind discretisation for momentum and turbulence quantities gives engineering-grade accuracy at design-cycle turnaround times.
Convergence
The solver iterates until residuals across all quantities — continuity, x/y/z velocity, turbulent kinetic energy, dissipation rate — drop to 1×10⁻⁷. Force monitors tracking drag and lift coefficients confirm aerodynamic loads have stabilised. A solution that has not converged is not a result. It is an incomplete calculation.
What the Results Show
ParameterResultDrag Coefficient (Cd)0.724Lift Coefficient (Cl)-3.21Downforce at 300 km/h1840 kgFront Wing Contribution32%Rear Wing Contribution44%Underbody Contribution24%Mesh Elements47.3 million cellsReynolds Number4.7 × 10⁶
A downforce figure of 1840 kg means the car is being pushed into the track with nearly twice its own weight in aerodynamic load. The negative lift coefficient confirms net downforce generation. The zonal breakdown tells the development engineer exactly where to focus — the rear wing at 44% is the dominant contributor, the underbody at 24% represents the highest development potential.
Velocity pathlines show where airflow attaches, accelerates, and separates across every surface. The surface pressure coefficient map shows where aerodynamic force is being generated — and where design changes would increase or reduce it. Wake turbulence visualisation identifies the turbulent structures that produce drag and create the dirty air downstream.
Why Validation Is What Separates Engineering from Computation
A non-converged, non-validated simulation can produce images that look identical to a properly executed one. The difference is in whether the numbers are reliable enough to make engineering decisions from.
Validation in CAE works at multiple levels — mesh independence studies confirming results are not artefacts of cell density, turbulence model sensitivity checks, and comparison against experimental data where available. These steps are not optional. They are what make CAE a genuine engineering tool rather than a visualisation exercise.
CAE Beyond Motorsport
F1 pushed CAE to its current capability because the performance return justified the investment. The methodology it developed — geometry preparation, high-fidelity meshing, physics-appropriate solver configuration, validated results — is now standard practice across automotive aerodynamics, aerospace engineering, industrial equipment design, thermal management, and structural analysis.
The teams that get the most from CAE are not the ones with the most powerful hardware. They are the ones with engineers who understand the physics, validate their results rigorously, and use simulation as a genuine decision-making tool — not a way to produce compelling images.
Simulate First. Validate Thoroughly. Build With Confidence.
CAE simulation does not eliminate engineering judgement. It gives engineers the quantitative data to apply that judgement accurately — at lower cost, earlier in the development cycle, with less risk than physical testing alone can provide.
That is the shift F1 demonstrated and the rest of engineering has adopted. Simulate, optimise, then build. It is not a trend. It is how modern engineering makes decisions.
APJ 3D provides CAE and CFD simulation services for automotive, aerospace, and industrial engineering clients across India — covering the full workflow from geometry preparation through solver execution to engineering reporting.
Reach out to Us: +91 75503 98310 | [email protected]
Know More About Us: www.apj3d.com