Industrial Equipment Benchmarking Services
Step into our Engineering Command Centre. Conduct meticulous side-by-side industrial product teardown engineering to decode competitor machinery, optimize manufacturing methodologies, and gain undisputed market advantage.
Why Observation Isn't Engineering Intelligence
Surface inspections lead to costly miscalculations. Click any observation below to uncover the empirical engineering intelligence revealed by thorough industrial machinery competitive analysis.
Ultrasonic thickness gauging proves a 4.2mm core wall reinforced by internal ribbing.
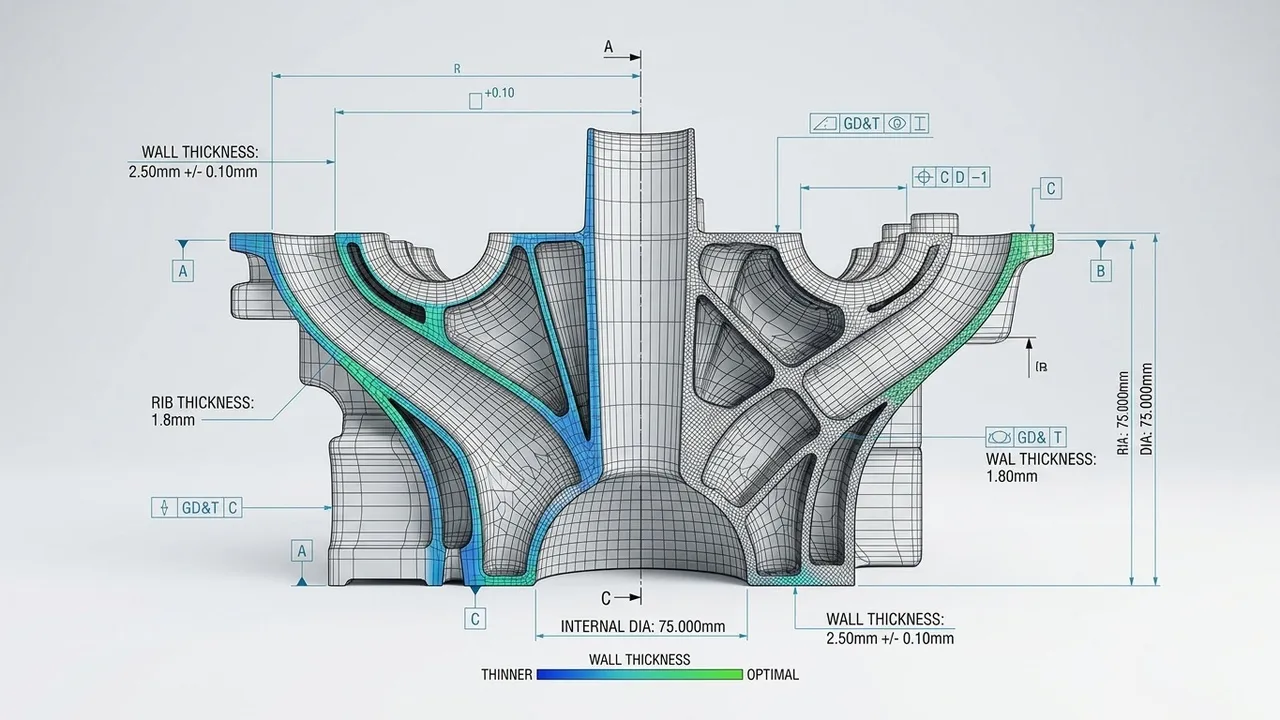
Engineering Evidence Beats Assumptions.
Stop guessing competitor tolerances. Eliminate guesswork with APJ3D's certified industrial equipment benchmarking study.
Initiate Your Comparison StudyInteractive Benchmarking Conveyor Workflow
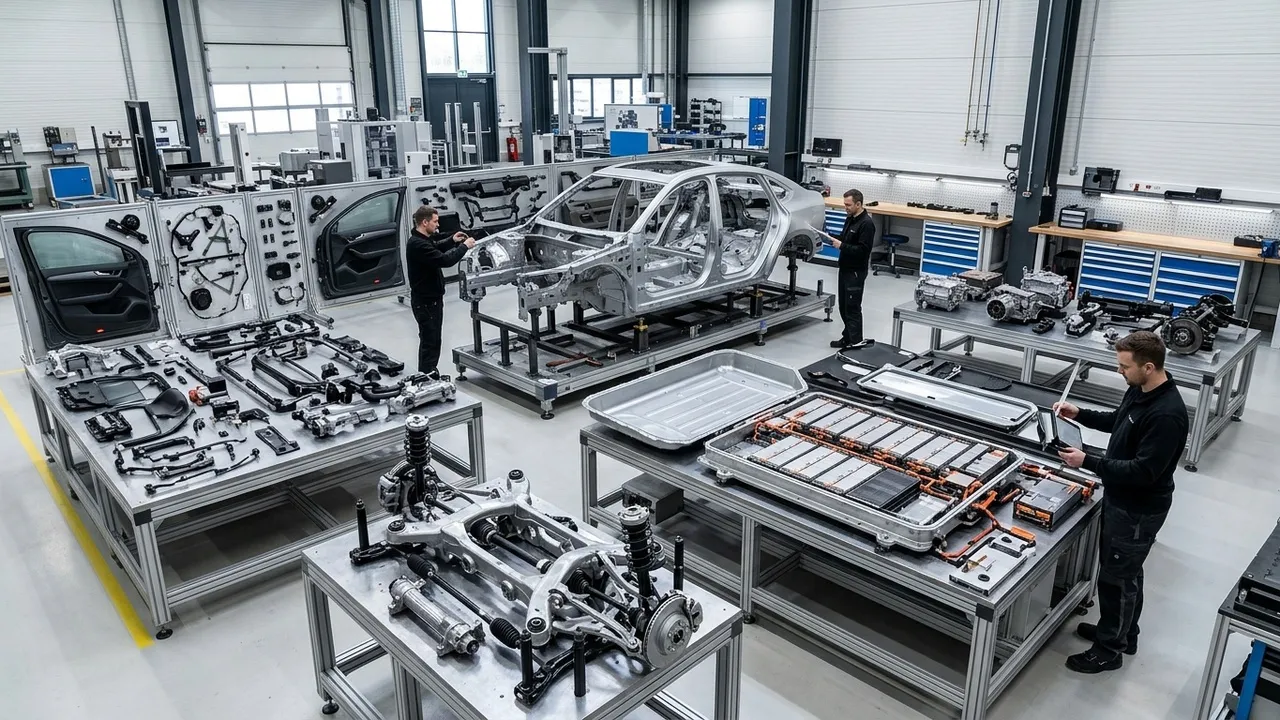
Designed like an automated engineering conveyor belt. Each station represents a progressive phase in our industrial equipment benchmarking services. Hover over any station to inspect technical notes.
Competitor Product
Strategic procurement, unboxing inspection, and baseline operational logging.
Interactive Benchmark Bento Matrix
Replacing conventional descriptive lists with an interactive engineering grid. Click any tile below to launch its live analytical telemetry and measurement overlays.
Geometry & Architecture
- Wall Thickness Distribution Analysis
- Hidden Fluid & Pneumatic Channels
- Internal Ribbing & Boss Features
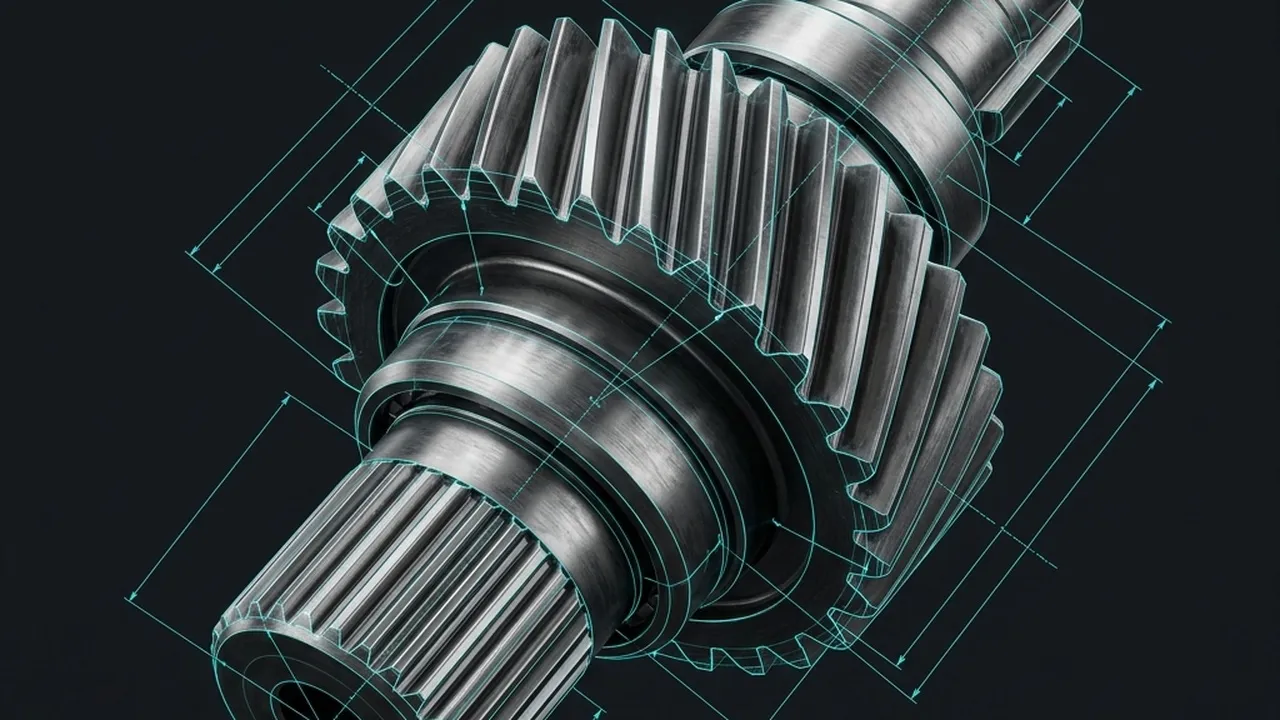
Feature-by-Feature Comparison Studio
Designed like advanced CAD inspection software. Select any parameter below to immediately simulate the comparative engineering differential between your equipment and competitor benchmarks.
Total Mass: 142.5 kg
Heavy fabricated steel housing with welded external reinforcement gussets. High safety factor but excess material waste.
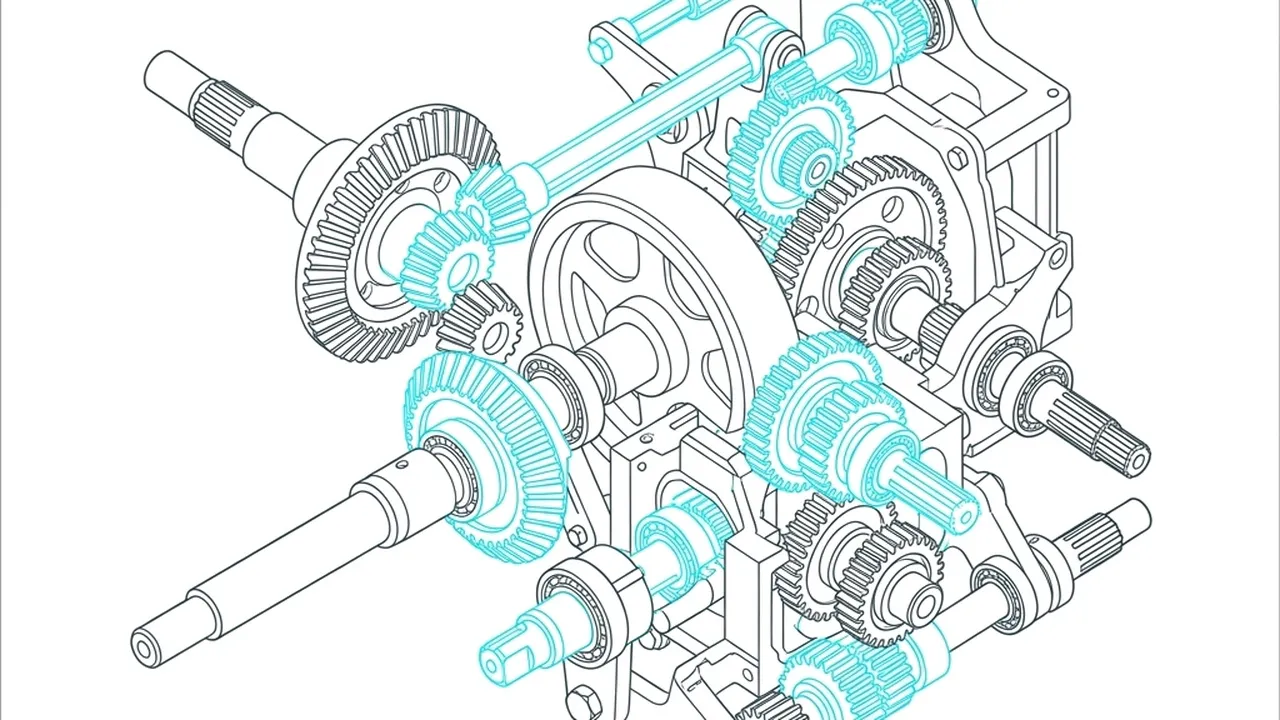
Total Mass: 128.0 kg (-10.1%)
Optimized thin-wall ductile iron casting with finite element optimized topological internal ribbing.

Development Intelligence Circular Hub
Explore our Circular Engineering Decision Map. Click any node around the central benchmark report to reveal how specific teardown data drives product development roadmaps.
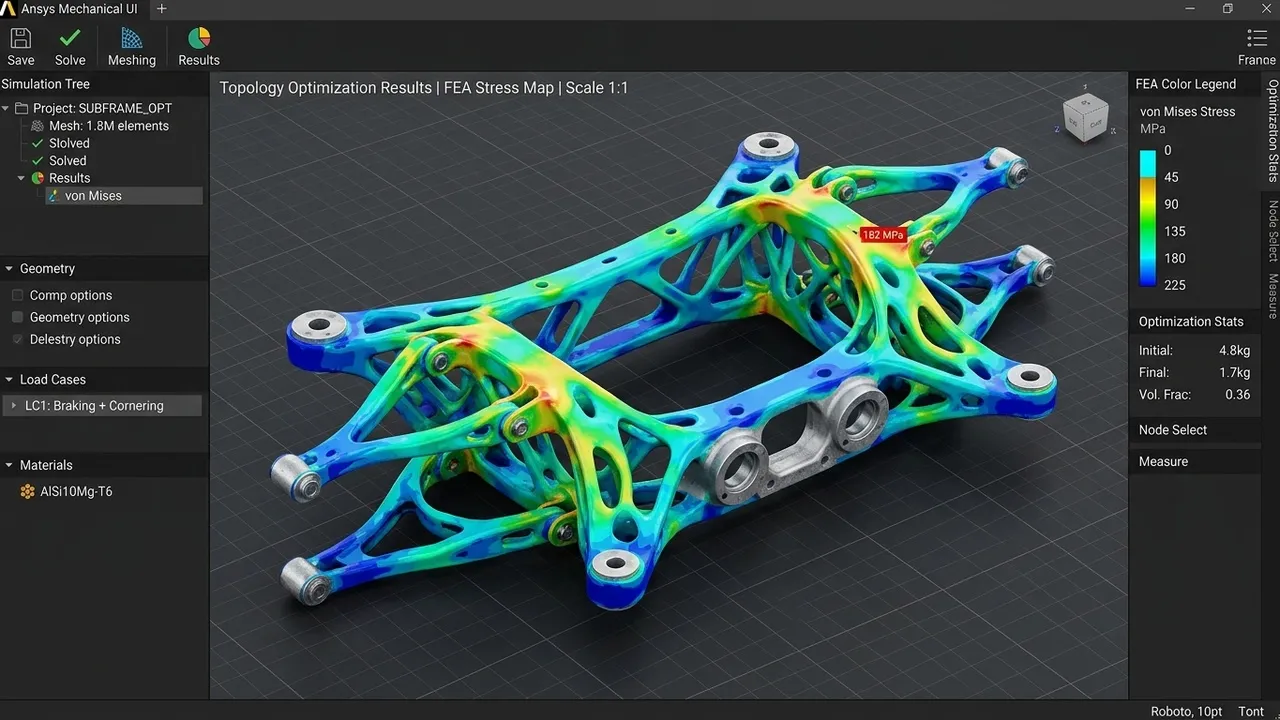
Topological Mass Optimization
By analyzing competitor load distribution patterns, we identify unstressed structural zones where material thickness can be safely shaved by up to 15% without sacrificing rigidity.
Interactive Engineering Deliverables Vault
Access our secure digital engineering cabinet. Click or inspect any deliverable package provided upon project completion across our Pan India delivery footprint.
Teardown Documentation Dossier
Complete teardown logging, high-resolution photographic dossier, and comprehensive fastener inventory generated during non-destructive dismantling.

What is Industrial Equipment Benchmarking Services?
Competitive Benchmarking and Should-Costing is the structured physical disassembly, material identification, process cycle-time estimation, and bottom-up cost modeling of competitor products and vehicle subsystems.
When to Select This Service
Choose teardown and should-costing when seeking actionable VAVE cost-reduction roadmaps (typically 10%–25% savings), supplier quotation validations, or competitive product intelligence.
Technical Capabilities & Verification Standards
Verified engineering parameters, hardware precision, and compliance benchmarks applied across all deliverables.
| Engineering Parameter | APJ 3D Capability & Precision Range | Compliance Standard / Verification |
|---|---|---|
| Benchmarking Scope | Full Vehicle Teardown (EV/ICE), Subsystems, Powertrains, Battery Packs, Industrial Equipment, Home Appliances | Standardized AIAG / VAVE Protocols |
| Costing Methodology | Bottom-Up Should-Costing (Raw material + Cycle time + Machine rates + Tooling amortization + SG&A/Profit) | Global & Indian Cost Databases |
| Material Characterization | Spectroscopy (OES/XRF), Polymer FTIR, Hardness Testing, Tensile & Microstructure Evaluation | NABL Accredited Lab Verification |
| Deliverables | Teardown Photo Books, Digital Bill of Materials (BOM), Should-Cost Models (Excel), VAVE Idea Roadmaps, CAD Assemblies | Complete Digital Teardown Portals |
| Typical Cost Savings | 10% to 25% achievable component cost reduction through DFM/VAVE recommendations | High-ROI Engineering Insights |
| Facility Capability | Dedicated 15,000+ sq.ft. Secure Vehicle & Subsystem Teardown Bays in Hosur & Chennai | NDAs & High-Security Protocols |
| Turnaround Time | 1 to 3 weeks for subsystem teardown and comprehensive should-cost models | Turnkey Benchmarking Programs |
Frequently Asked Questions
What is included in a product teardown report?
What is included in a product teardown report?
How does should-costing help in supplier negotiations?
How does should-costing help in supplier negotiations?
What is VAVE and how do you generate savings ideas?
What is VAVE and how do you generate savings ideas?
Can you benchmark electric vehicle (EV) battery packs and powertrains?
Can you benchmark electric vehicle (EV) battery packs and powertrains?
How do you maintain confidentiality and intellectual property during teardowns?
How do you maintain confidentiality and intellectual property during teardowns?
Ready to Benchmark Your Next Product Generation?
Empower your R&D team with empirical intelligence — APJ 3D Delivers Actionable Industrial Equipment Benchmarking Across India.