Product Benchmarking & Teardown Services for Industrial and Commercial Products
Dismantle competitor mysteries. We deliver comprehensive physical teardowns, dimensional precision, BOM extraction, and should-cost modeling to empower your next-generation engineering decisions.
What Is Product Benchmarking & Teardown?
Product benchmarking and teardown is the disciplined practice of physically dismantling a competitor's or reference product to extract verifiable engineering, cost, and manufacturing intelligence — data you can act on rather than assumptions you have to guess at.
Competitive Teardown
Non-destructive, systematic dismantling of a purchased product, cataloguing every fastener, sub-assembly, and component into a structured engineering record before any analysis begins.
BOM & Should-Cost Analysis
Full bill-of-materials extraction paired with should-cost modeling — raw material economics, cycle time, and tooling amortization — to reveal how a competitor's manufacturing cost structure compares with your own.
Design & Dimensional Intelligence
3D scanning, GD&T verification, and material identification that feed directly into reverse-engineered CAD models and value-engineering recommendations for your next design iteration.
Why Product Benchmarking Matters
“Your Competitor's Product Is the Most Honest Brief You Will Ever Read.”
Instead of guessing market standards, reverse engineer them. We transform physical competitive hardware into actionable engineering timelines and value improvements.
Market Product
Strategic procurement and baseline engineering capture. Establishing ground-truth metrics before non-destructive evaluation begins.

Benchmarking Capabilities
Explore our interconnected engineering expertise across industrial equipment, consumer goods, and precision systems.
Product Benchmarking
Core competitor evaluation & architecture comparison. Every capability module feeds into our master engineering database. Whether analyzing an aerospace turbine blade or an industrial actuator, we provide verifiable reports.

What We Extract From Every Product
Our exploded product intelligence dashboard captures granular technical specifications from every fastener, housing, and PCB.
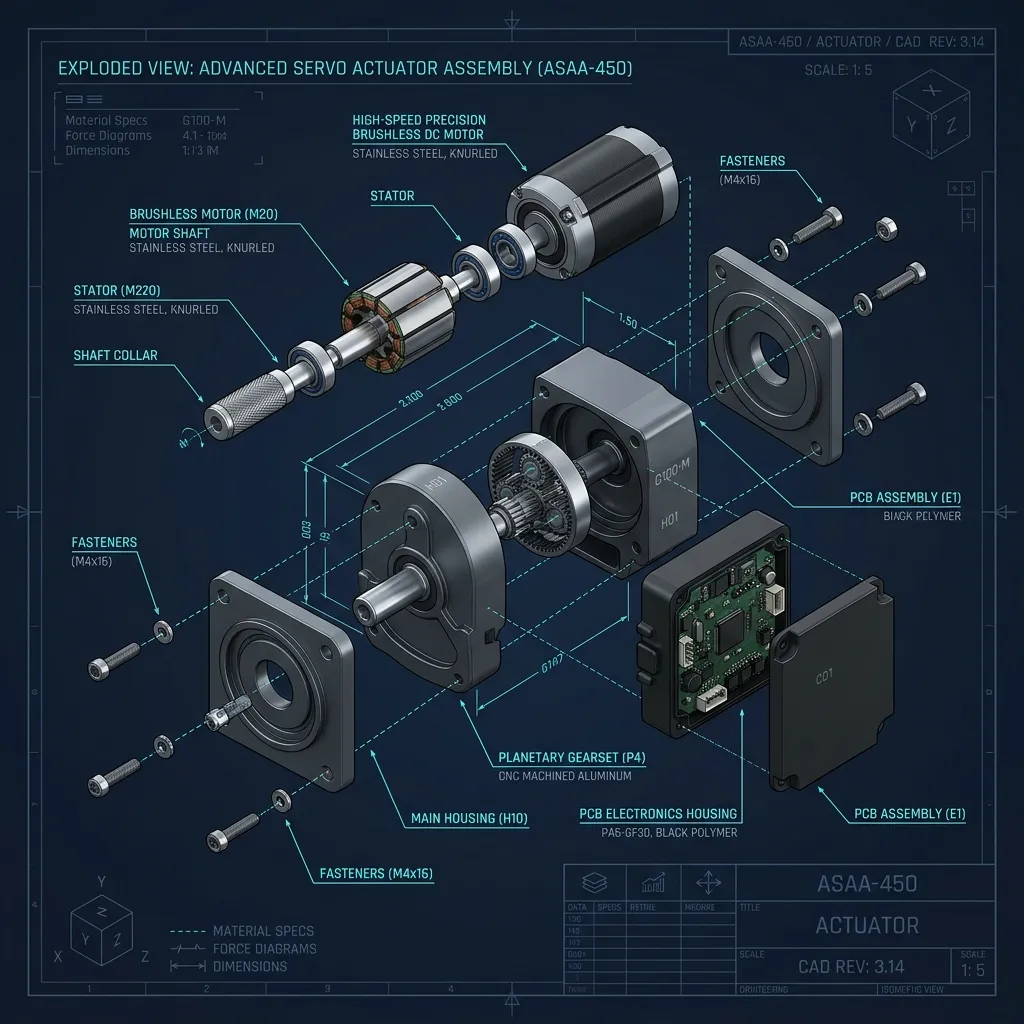
BOM Extraction
Complete hierarchy of assemblies, sub-components, vendor tags, and fastener quantities.
Should Cost Modeling
Raw material economics, cycle time estimation, machine hourly rates, and tooling amortization.
Wall Thickness & Draft
Ultrasonic and CT scan verification of rib profiles, draft angles, and structural integrity.
Assembly Logic
Sequence analysis, poka-yoke features, insertion forces, and automation feasibility.
Industries We Benchmark
Our teardown labs support high-stakes sectors across India and global supply chains.
Industrial Equipment & Machinery
Pumps, valves, heavy gearboxes, and automated actuators. We extract tolerance stacks and metallurgy data.
Medical Devices & Healthcare
Surgical instruments, diagnostic enclosures, and implantable hardware. Cleanroom compatible non-destructive teardowns.
Aerospace & Defense
Turbine blades, drone airframes, and avionics housings. Extreme precision 3D scanning and lightweighting analysis.
Consumer Appliances & Electronics
Washing machines, HVAC units, kitchen appliances, and smart wearables. High-volume should-cost reduction.
From Teardown to Engineering Decision
Our systematic 8-stage blueprint transforms physical hardware into confident executive boardroom strategies. This detailed execution view expands the 6-stage value chain introduced above (Market Product through Improvement) into the granular engineering steps our teardown lab actually runs.
Competitor Product
Market sourcing & unboxing logging.
Physical Teardown
Non-destructive dismantling & BOM.
3D Scanning
Blue light sub-micron digitisation.
Material Analysis
OES spectrometry & hardness check.
Cost Benchmarking
Should-cost & vendor margin estimation.
CAD Reconstruction
Parametric STEP/IGES feature tree.
Recommendations
Value engineering & VAVE matrix.
Design Improvement
Superior competitive product launch.
A-to-Z Benchmarking Completed in 2 Days
Need rapid competitive insights before your upcoming design review? Our dedicated teardown cell handles emergency turnaround schedules across India.
Initiate Urgent Benchmark ProjectDeliverables & Value Matrix
Compare our exhaustive reporting depth against traditional surface inspection methods.
Executive Boardroom Package
Delivered in interactive PDF, native CAD directories, and raw Excel cost breakdown structures.
Teardown Analysis vs Competitive Benchmarking
A teardown analysis is a single-product exercise — it documents what one product is made of and how it is built. Competitive benchmarking uses that same teardown data but sets it side-by-side against your own product (or several competitors) to produce a scored, comparative decision on cost, weight, and design.
Teardown Analysis
- Documents one product: BOM, materials, dimensions
- Output: component catalogue & standalone report
- No direct cost or performance comparison
- Typically the data-capture stage of a larger study
Competitive Benchmarking
- Compares 2+ products side-by-side against a scorecard
- Output: gap analysis, should-cost delta, VAVE matrix
- Directly informs sourcing, pricing & design targets
- Builds on teardown data from every product in the set
See how this plays out at vehicle scale in our automotive benchmarking service, or narrowed to pure economics in our should-cost analysis service.
What is Product Benchmarking & Teardown Services in India?
Competitive Benchmarking and Should-Costing is the structured physical disassembly, material identification, process cycle-time estimation, and bottom-up cost modeling of competitor products and vehicle subsystems.
When to Select This Service
Choose teardown and should-costing when seeking actionable VAVE cost-reduction roadmaps (typically 10%–25% savings), supplier quotation validations, or competitive product intelligence.
Technical Capabilities & Verification Standards
Verified engineering parameters, hardware precision, and compliance benchmarks applied across all deliverables.
| Engineering Parameter | APJ 3D Capability & Precision Range | Compliance Standard / Verification |
|---|---|---|
| Benchmarking Scope | Full Vehicle Teardown (EV/ICE), Subsystems, Powertrains, Battery Packs, Industrial Equipment, Home Appliances | Standardized AIAG / VAVE Protocols |
| Costing Methodology | Bottom-Up Should-Costing (Raw material + Cycle time + Machine rates + Tooling amortization + SG&A/Profit) | Global & Indian Cost Databases |
| Material Characterization | Spectroscopy (OES/XRF), Polymer FTIR, Hardness Testing, Tensile & Microstructure Evaluation | NABL Accredited Lab Verification |
| Deliverables | Teardown Photo Books, Digital Bill of Materials (BOM), Should-Cost Models (Excel), VAVE Idea Roadmaps, CAD Assemblies | Complete Digital Teardown Portals |
| Typical Cost Savings | 10% to 25% achievable component cost reduction through DFM/VAVE recommendations | High-ROI Engineering Insights |
| Facility Capability | Dedicated 15,000+ sq.ft. Secure Vehicle & Subsystem Teardown Bays in Hosur & Chennai | NDAs & High-Security Protocols |
| Turnaround Time | 1 to 3 weeks for subsystem teardown and comprehensive should-cost models | Turnkey Benchmarking Programs |
Frequently Asked Questions
What is included in a product teardown report?
What is included in a product teardown report?
How does should-costing help in supplier negotiations?
How does should-costing help in supplier negotiations?
What is VAVE and how do you generate savings ideas?
What is VAVE and how do you generate savings ideas?
Can you benchmark electric vehicle (EV) battery packs and powertrains?
Can you benchmark electric vehicle (EV) battery packs and powertrains?
How do you maintain confidentiality and intellectual property during teardowns?
How do you maintain confidentiality and intellectual property during teardowns?
Ready to Benchmark Your Competitor's Product?
From Complete Physical Teardowns to Should-Cost Modeling — APJ 3D Delivers Actionable Competitive Intelligence for Your Products.