Product Packaging Benchmarking Services
Great packaging is engineered, not just designed. We dissect consumer containers layer-by-layer through non-destructive 3D scanning and packaging design competitive analysis to reveal exact wall thicknesses, closure interfaces, and structural optimization secrets.
A Better Package Isn't Always Thicker. It's Smarter.
Flip between what consumers perceive on the retail shelf and what our non-destructive engineering evaluation reveals underneath the surface geometry.
Thin Wall Construction
Appears lightweight and potentially fragile under vertical load.
Optimised Rib Network
Micro-rib structural reinforcement maintains 100% top-load stacking strength while cutting plastic volume by 18%.
Smaller Closure Profile
Minimalist cap design that seems less secure against carbonation pressure.
Tolerance Optimization
Thread lead angle precision ensures zero CO2 leakage with 30% less twisting force required by the consumer.
Lower Package Weight
Noticeably lighter feel in hand during transportation and display.
Material Flow Improvement
Optimized preform stretching eliminates thin spots and stress concentrations during blow molding.
Better Drop Performance
Survives accidental 1.5-meter impact without rupture or deformation.
Base Geometry Design
Petaloid base curvature absorbs kinetic shock waves and redistributes hydraulic pressure evenly.



Packaging Intelligence Workflow Journey
Unlike standard timelines, our benchmarking process unfolds like an engineered origami dieline—each phase revealing critical structural data.
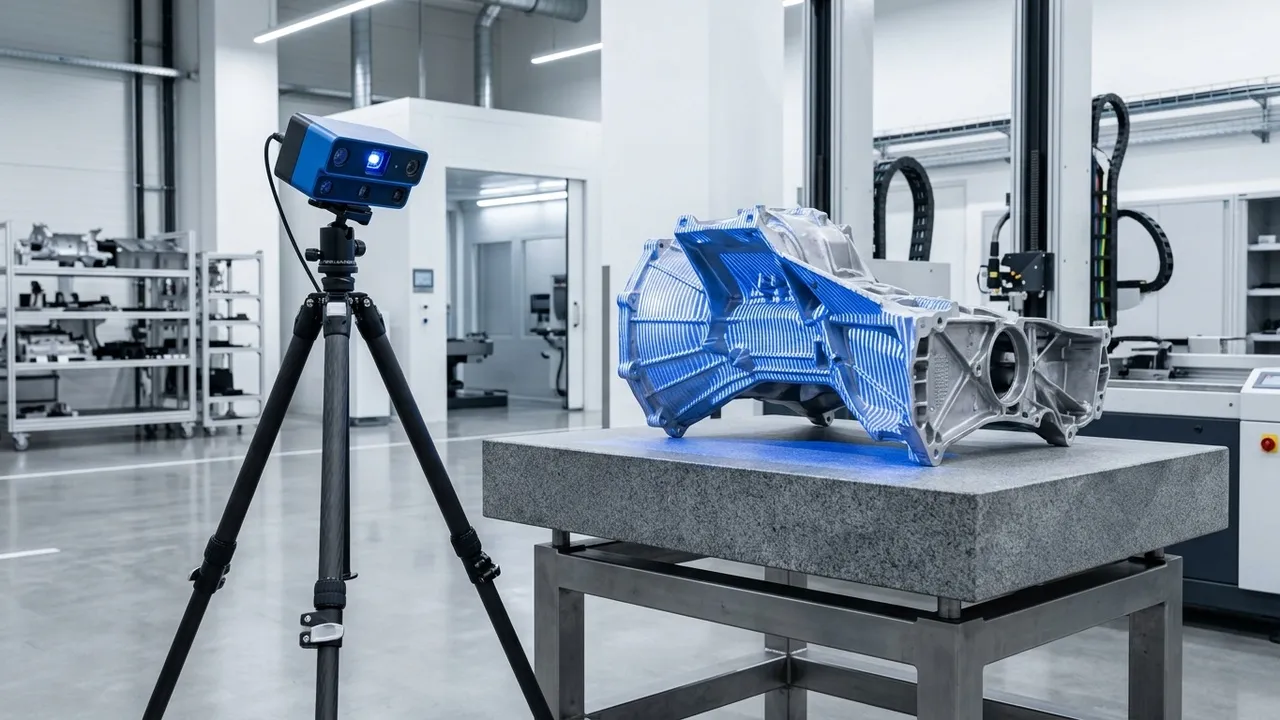
We acquire high-resolution point clouds using ZEISS and Creaform optical scanners without deforming flexible or thin-walled consumer packaging.
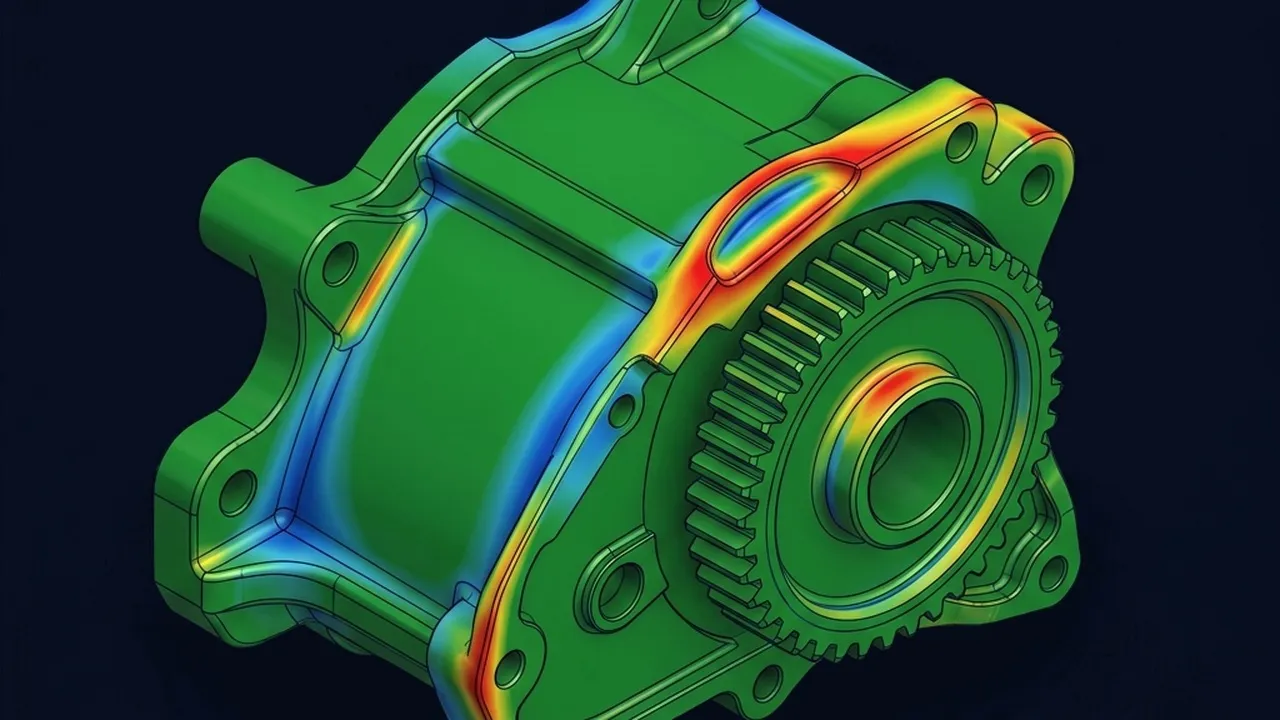
Color-coded heatmaps highlight exact resin distribution, identifying vulnerable thin spots or over-engineered material clusters.

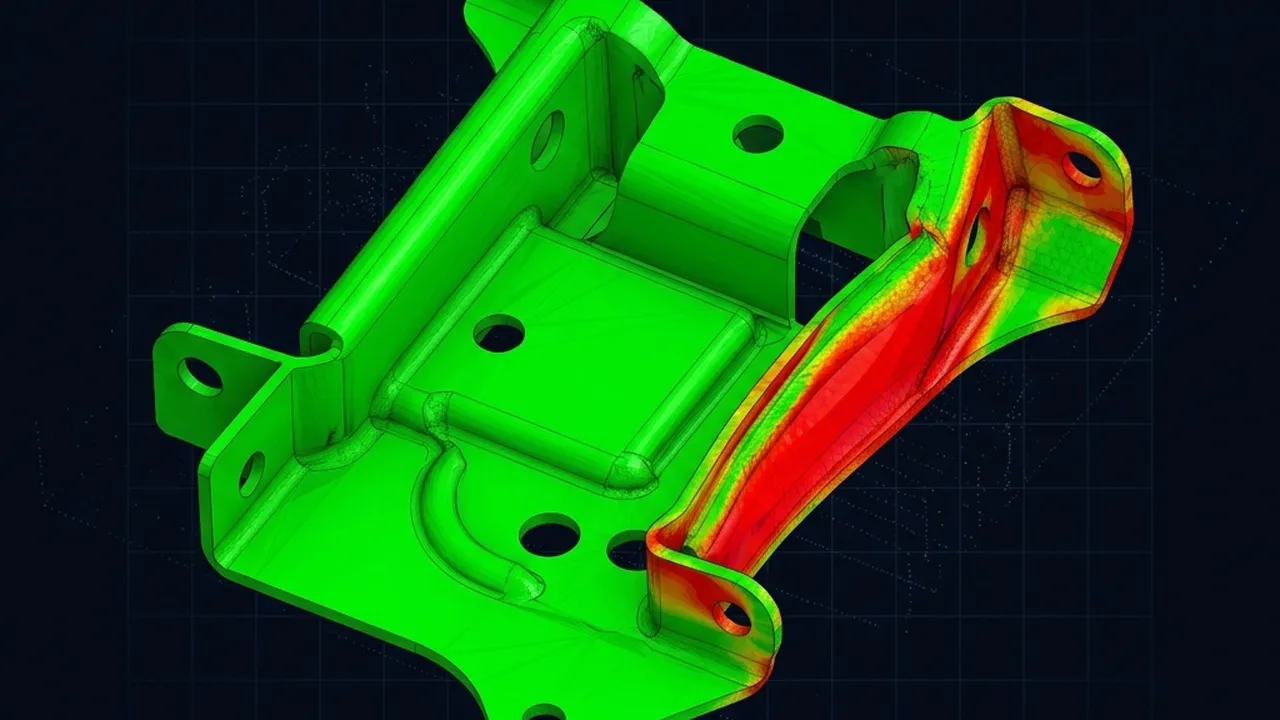
We cross-reference nominal CAD models against real-world manufactured closures to measure shrinkage, warping, and thread pitch accuracy.
Delivering actionable CAD geometry adjustments and material recommendations to achieve superior shelf durability and reduced cost.

Structural Intelligence Anatomy Explorer
Click through different structural zones of our interactive packaging cutaway to operate our empirical measurement software.




Closure Profile & Torque Analysis
Evaluating knurling geometry, removal torque variance, and tamper-evident band retention mechanics across competitor product lines.
Competitor Comparison Studio
Simulate our real-time packaging comparison software. Select a structural metric to compare your container against industry leaders.
Material Usage Comparison
LIVE METRICRedesigning the shoulder transition angle allows a 14.2% resin reduction while passing 100% of standard top-load compression requirements.
Interactive Design Decision Blueprint Lab
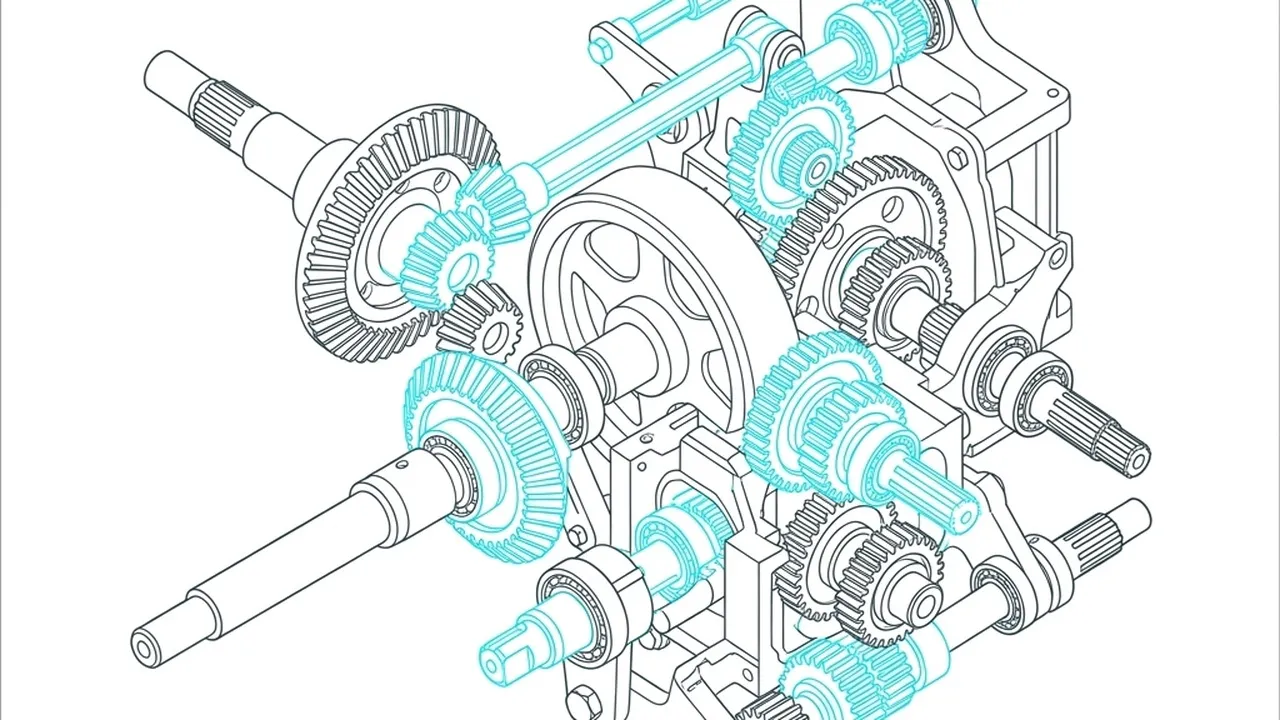
Explore our Blueprint Decision Board. Click any surrounding engineering node to see how trade-offs impact central CAD packaging architecture.
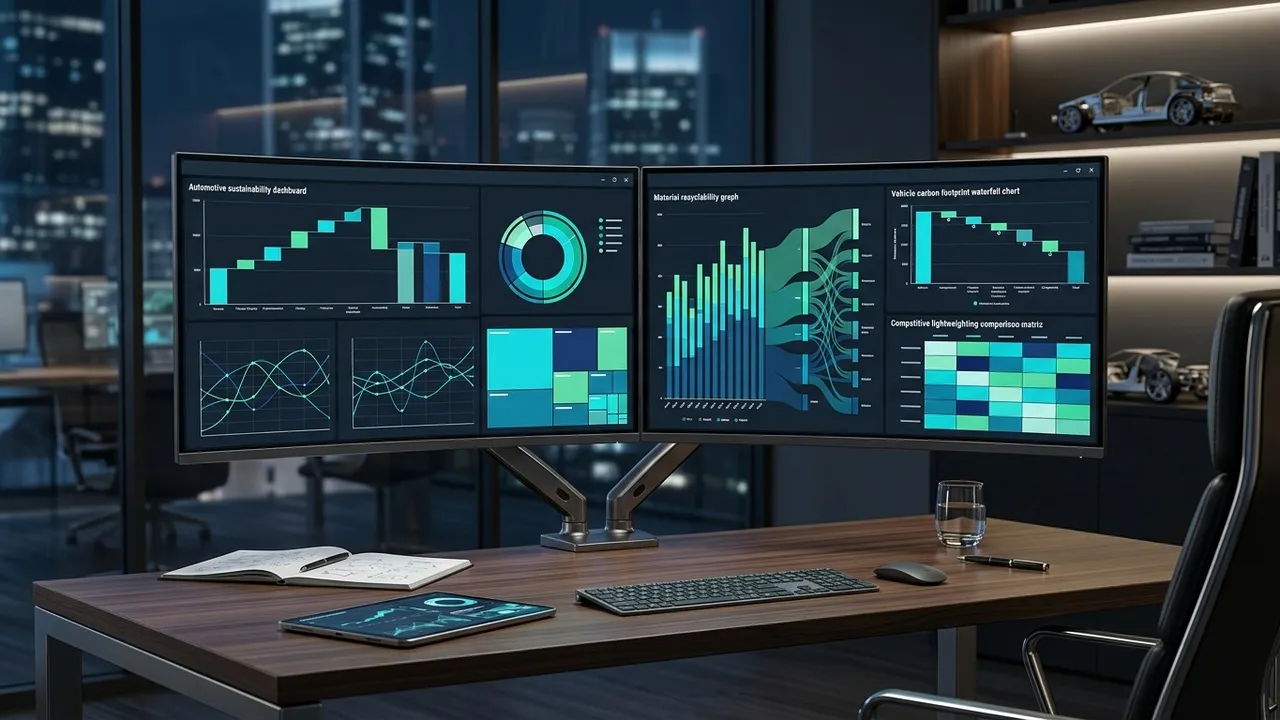
Material Saving vs Wall Stability
By substituting uniform wall thickness with variable ribbed geometry, clients achieve substantial material cost reductions without buckling under warehouse pallet stacking loads.
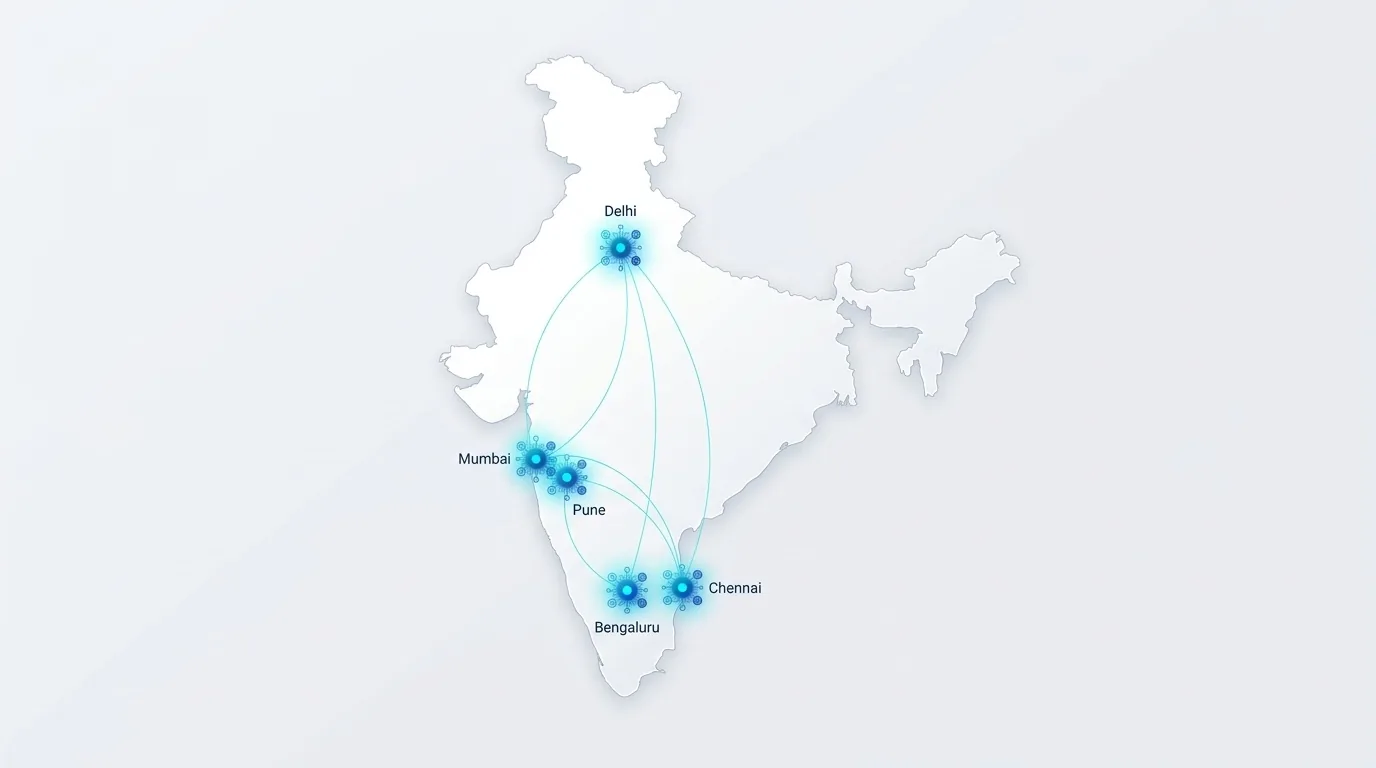
Digital Packaging Archive & India Operations
Hover or click sliding cabinet drawers to inspect sample engineering deliverables generated across our Pan-India metrology network.
Hosur // Chennai // Coimbatore
Rapid onsite or lab-based sample acquisition and non-destructive benchmarking across all major industrial clusters in India.
What is Product Packaging Benchmarking Services?
Competitive Benchmarking and Should-Costing is the structured physical disassembly, material identification, process cycle-time estimation, and bottom-up cost modeling of competitor products and vehicle subsystems.
When to Select This Service
Choose teardown and should-costing when seeking actionable VAVE cost-reduction roadmaps (typically 10%–25% savings), supplier quotation validations, or competitive product intelligence.
Technical Capabilities & Verification Standards
Verified engineering parameters, hardware precision, and compliance benchmarks applied across all deliverables.
| Engineering Parameter | APJ 3D Capability & Precision Range | Compliance Standard / Verification |
|---|---|---|
| Benchmarking Scope | Full Vehicle Teardown (EV/ICE), Subsystems, Powertrains, Battery Packs, Industrial Equipment, Home Appliances | Standardized AIAG / VAVE Protocols |
| Costing Methodology | Bottom-Up Should-Costing (Raw material + Cycle time + Machine rates + Tooling amortization + SG&A/Profit) | Global & Indian Cost Databases |
| Material Characterization | Spectroscopy (OES/XRF), Polymer FTIR, Hardness Testing, Tensile & Microstructure Evaluation | NABL Accredited Lab Verification |
| Deliverables | Teardown Photo Books, Digital Bill of Materials (BOM), Should-Cost Models (Excel), VAVE Idea Roadmaps, CAD Assemblies | Complete Digital Teardown Portals |
| Typical Cost Savings | 10% to 25% achievable component cost reduction through DFM/VAVE recommendations | High-ROI Engineering Insights |
| Facility Capability | Dedicated 15,000+ sq.ft. Secure Vehicle & Subsystem Teardown Bays in Hosur & Chennai | NDAs & High-Security Protocols |
| Turnaround Time | 1 to 3 weeks for subsystem teardown and comprehensive should-cost models | Turnkey Benchmarking Programs |
Frequently Asked Questions
What is included in a product teardown report?
What is included in a product teardown report?
How does should-costing help in supplier negotiations?
How does should-costing help in supplier negotiations?
What is VAVE and how do you generate savings ideas?
What is VAVE and how do you generate savings ideas?
Can you benchmark electric vehicle (EV) battery packs and powertrains?
Can you benchmark electric vehicle (EV) battery packs and powertrains?
How do you maintain confidentiality and intellectual property during teardowns?
How do you maintain confidentiality and intellectual property during teardowns?
Ready to Discover Why Your Competitor's Packaging Performs Better?
Empower your packaging engineering team with measured structural intelligence. Schedule a consultation with our packaging specialists today.