Sheet Metal Forming Analysis
Services India (ARGUS)
Validate formability, full-field strain distribution, and Forming Limit Curves (FLC) using non-contact optical ARGUS photogrammetry before production tooling is finalized.
Why Sheet Metal Forming Analysis Cannot Wait Until First Article Inspection
Don't Guess. Measure the Strain.
Micro-tears and excessive thinning often go unnoticed by the naked eye during tryouts. Once the tool goes into mass production, these invisible defects manifest as scrapped parts and catastrophic failure.
Our sheet metal formability testing service India identifies the precise strain distribution across the entire part, ensuring it stays well within the safety margins of the Forming Limit Curve.
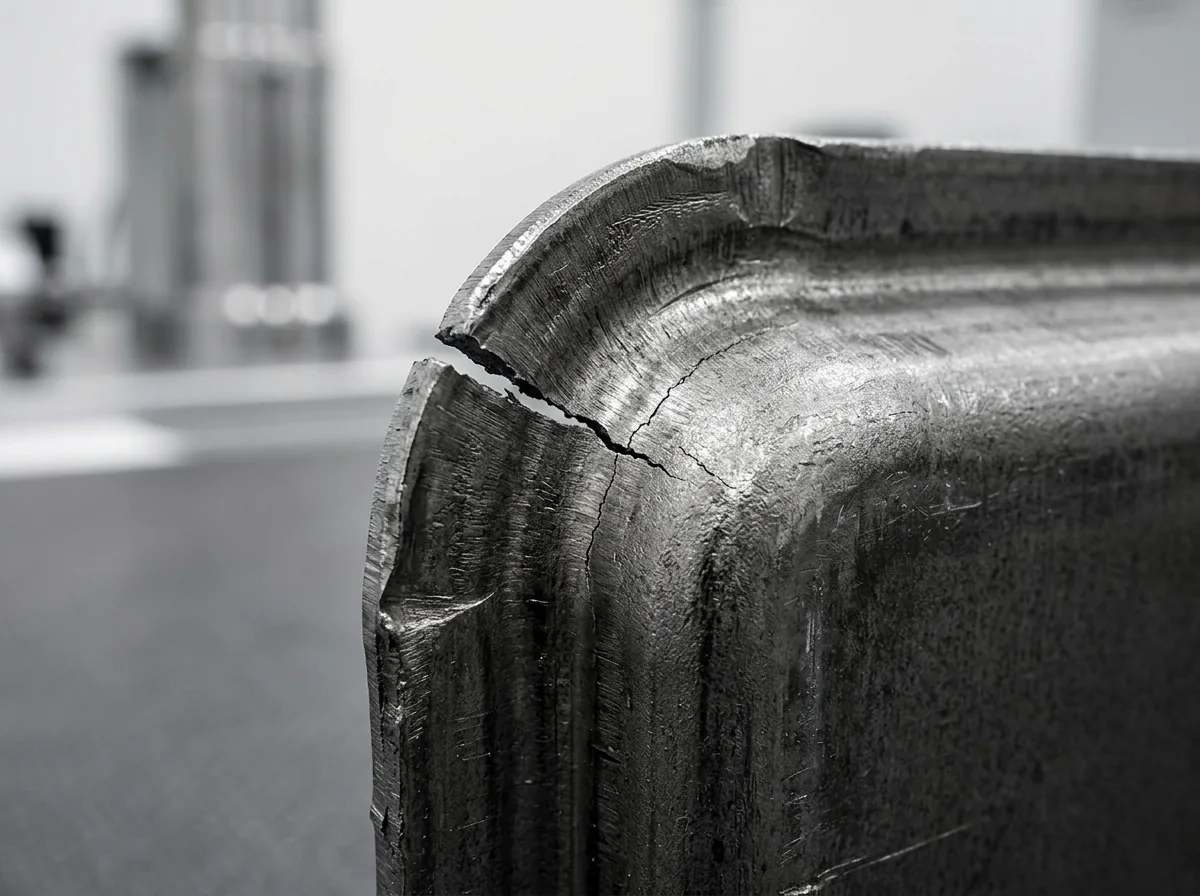
ARGUS Forming Analysis Service for Sheet Metal India
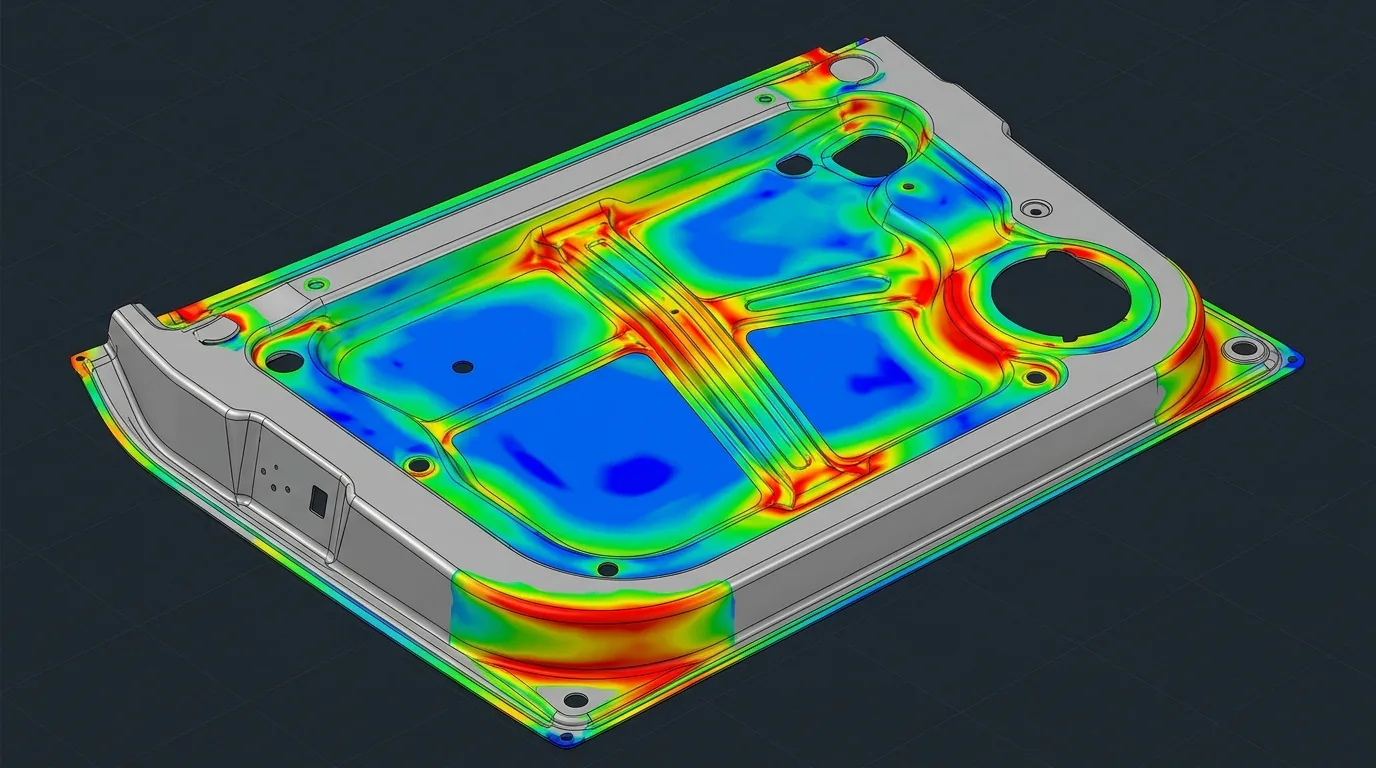
Full-field Strain Mapping
Captures precise major and minor strain values across complex geometries.
Thickness Reduction Analysis
Accurate heatmap calculation of material thinning post-stamping.
Forming Limit Curve (FLC) Overlay
Direct comparison of empirical strain data against the material's failure limits.
Multi-camera Photogrammetry
Sub-pixel accuracy using high-resolution optical measurement systems.
Connecting Material & Process Variables
Material Behaviour
- Tensile Data
- Flow Curve
- r-value & n-value
- Material Characterisation
Process Behaviour
- Blank Holder Force
- Lubrication & Draw Beads
- Tool Geometry
- Press Parameters
Precision relies on the stochastic dot pattern applied to the blank before forming.
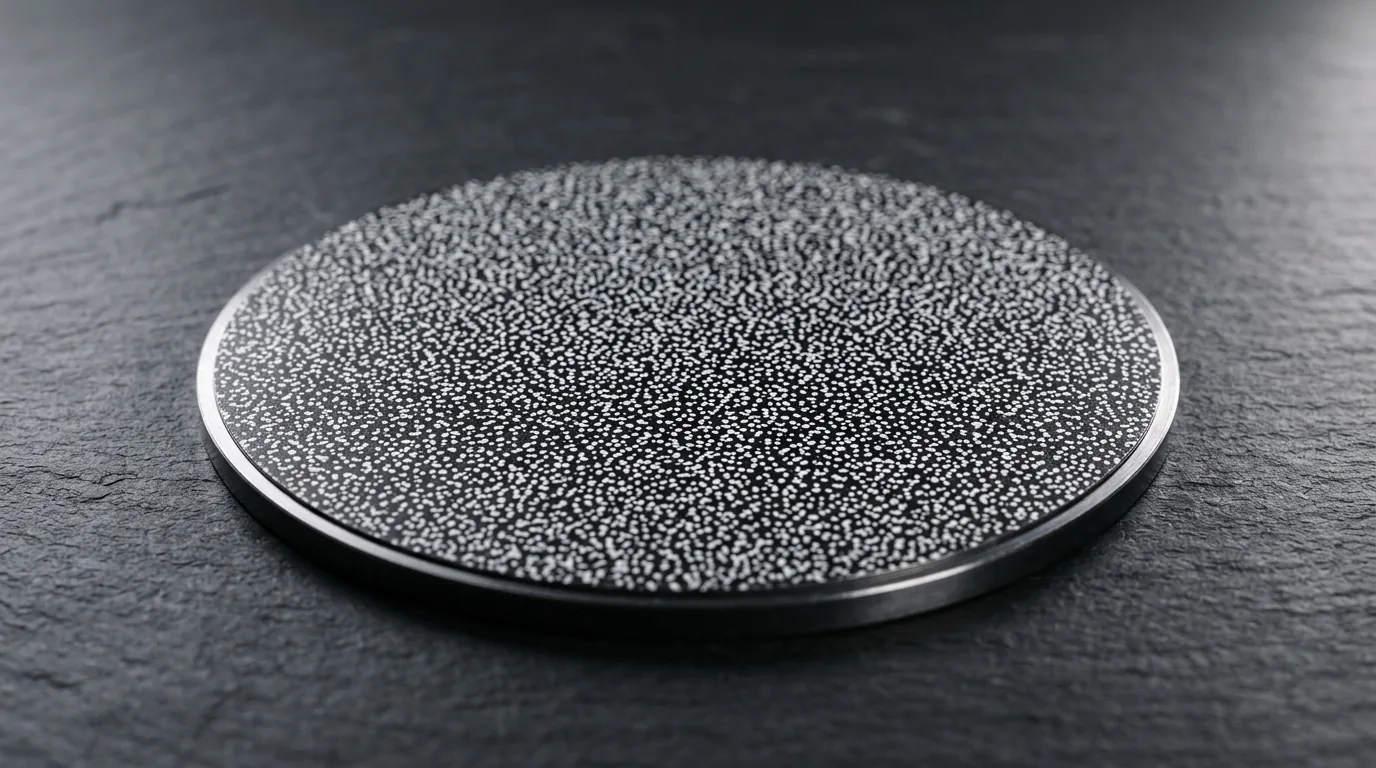
Sheet Metal Strain Analysis & Forming Limit Service India
Capturing stamped panels directly at your press shop.
Optical system reads the deformed stochastic pattern.
Plotting strain states against the Forming Limit Curve.
Identifying critical zones of excessive thinning.
Data-driven feedback for tool and die modification.
Generating OEM-compliant formability reports.
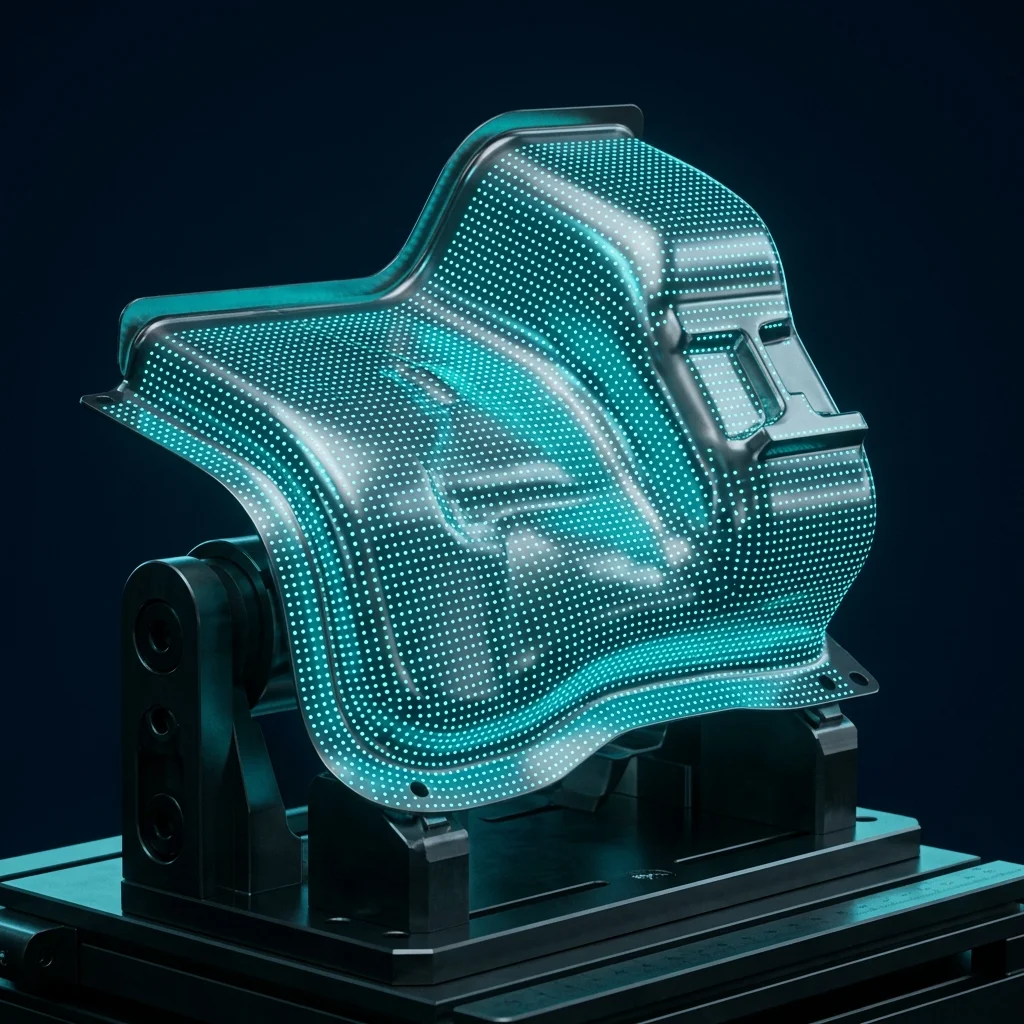
Forming Analysis Service for Automotive Stamping & Mfg

Automotive
BIW components, chassis parts, and complex deep-drawn enclosures.
Challenge: Complex Geometries
White Goods
Washing machine drums, refrigerator panels, and HVAC housings.
Challenge: Aesthetic Quality
Aerospace
High-strength aluminium and titanium formed skin panels.
Challenge: Material Cost & Yield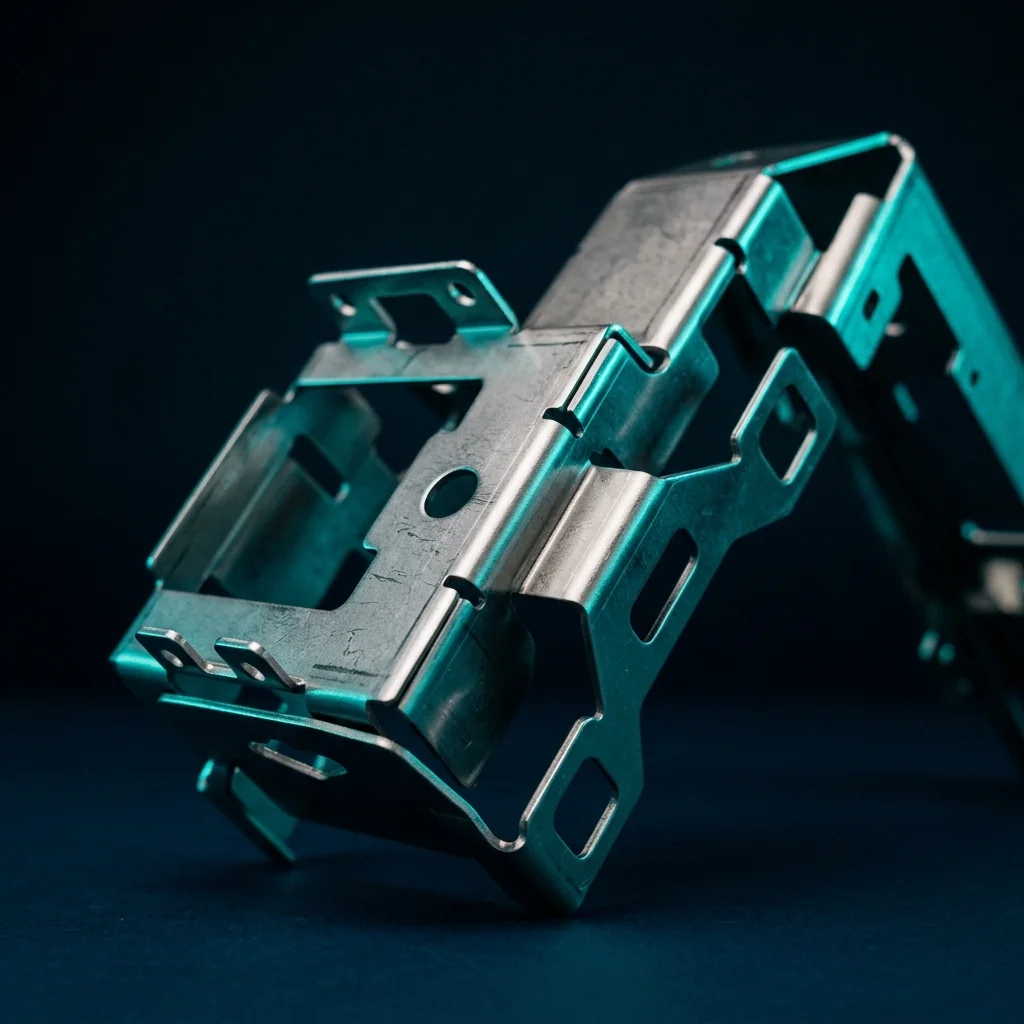
Precision Sheet Metal
Electronic enclosures, battery casings, and structural brackets.
Challenge: Tight Tolerances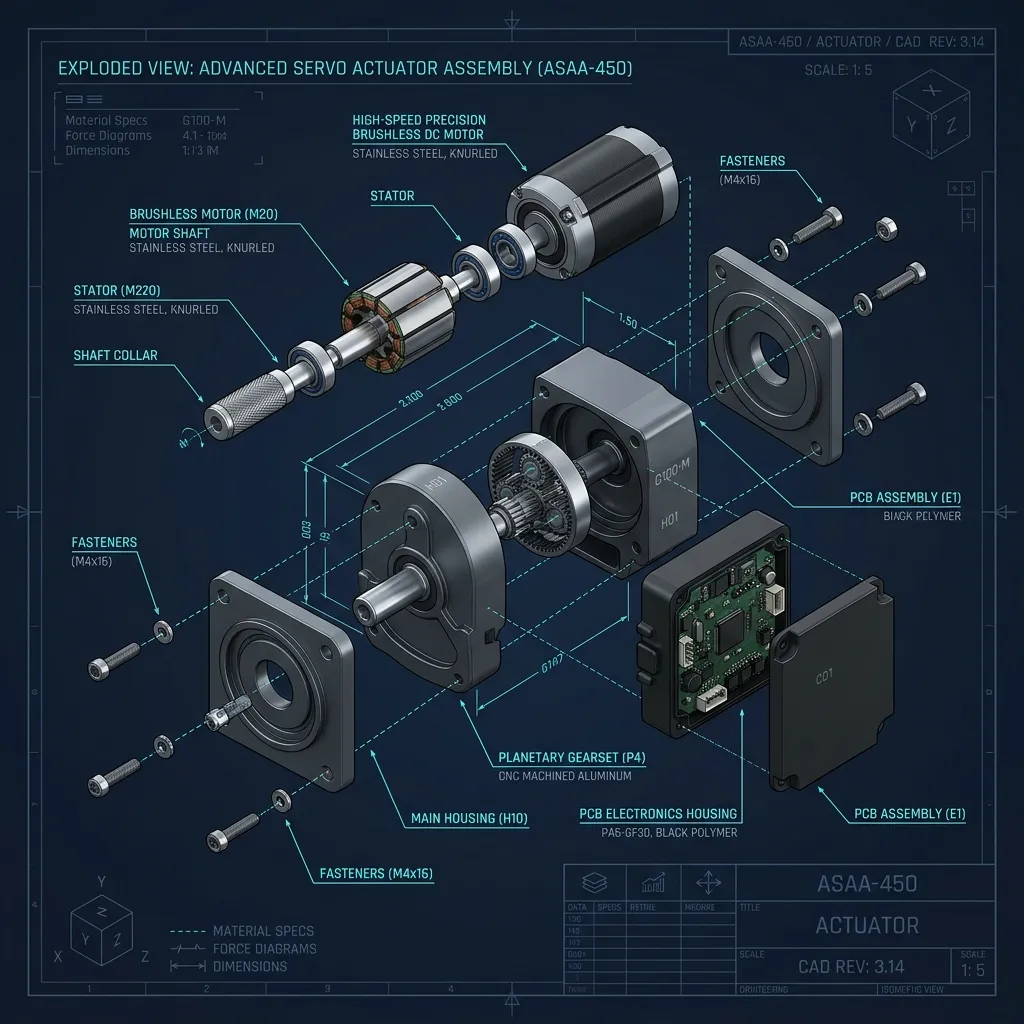
Consumer Products
High-volume stamped components requiring rapid die tryouts.
Challenge: Speed to MarketWhat APJ 3D Delivers
Colour Strain Maps
- ✔ Full field 3D visualization
- ✔ Major & minor strain overlay
Thickness Reduction Map
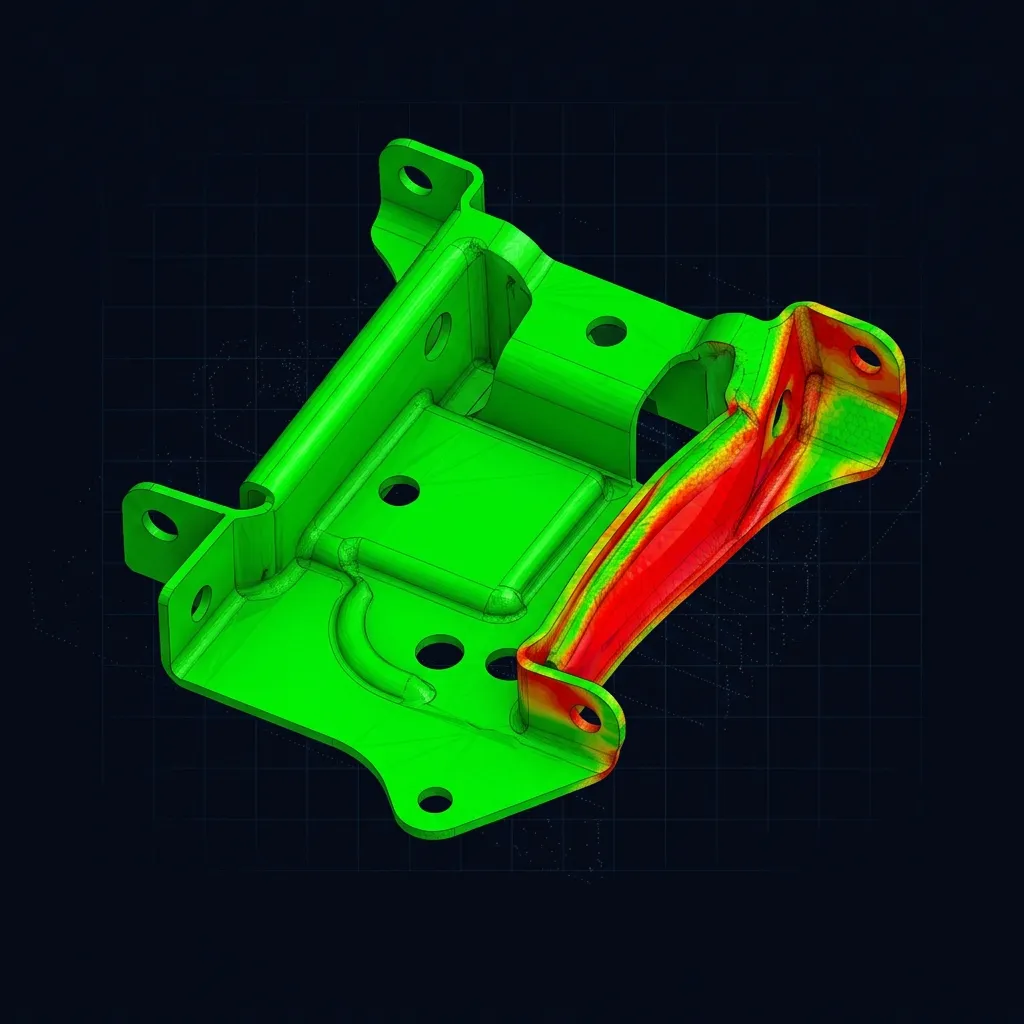
- ✔ Percentage thinning analysis
- ✔ Critical risk zone identification
FLC Overlay Report

- ✔ Empirical data vs Material Limits
- ✔ Safety margin quantification
Process Recommendations

- ✔ Blank shape optimisation
- ✔ Binder pressure adjustments
What is Sheet Metal Forming Analysis Service India (ARGUS)?
ARGUS forming analysis is a non-contact optical strain measurement method that applies a stochastic dot or grid pattern to a formed sheet metal blank, then uses photogrammetry to capture full-field strain distribution and generate Forming Limit Curves (FLC) that identify necking, splitting, and thinning risk.
When to Select This Service
Choose ARGUS forming analysis when you need to validate formability and full-field strain distribution before production tooling is finalized, or to diagnose splits, wrinkles, and thinning on existing stamped parts.
Technical Capabilities & Verification Standards
Verified engineering parameters, hardware precision, and compliance benchmarks applied across all deliverables.
| Engineering Parameter | APJ 3D Capability & Precision Range | Compliance Standard / Verification |
|---|---|---|
| Measurement Method | Non-contact optical ARGUS photogrammetry capturing full-field strain across the stamped surface | Optical Forming & Strain Analysis |
| Strain Evaluation | Major/minor strain measurement and percentage thinning heatmap generated post-stamping | Percentage Thinning Analysis |
| FLC Overlay | Measured strain points plotted against the material's Forming Limit Curve to flag necking and split risk zones | FLC Curve Evaluation |
| Defect Detection | Identification of micro-tears, localized necking, and excessive thinning invisible to the naked eye during tryouts | Pre-Production Defect Capture |
| Service Timing | Performed during tool tryout, before mass production tooling is finalized | Ahead of First Article Inspection |
| Deliverables | Thinning heatmap visualization and FLC overlay engineering evaluation graphs | Engineering Evaluation Reports |
| Industry Application | Automotive stamping and manufacturing programs eliminating wrinkling, thinning, and splits before production | Automotive Stamping & Mfg |
Frequently Asked Questions
Can you perform 3D scanning on-site at our manufacturing plant?
Can you perform 3D scanning on-site at our manufacturing plant?
How do 3D scanning and reverse engineering differ?
How do 3D scanning and reverse engineering differ?
What is a color deviation inspection map?
What is a color deviation inspection map?
Can dark, shiny, or transparent surfaces be scanned?
Can dark, shiny, or transparent surfaces be scanned?
What accuracy can we expect for automotive and aerospace components?
What accuracy can we expect for automotive and aerospace components?
Verify Sheet Metal Formability Before
Tooling Makes the Decision Permanent.
Leverage our high-resolution ARGUS optical strain analysis service in India. Eliminate wrinkling, thinning, and splits before production stampings.