Simulation Tells You What Happened —
Interpretation Tells You What to Do
Transform raw FEA reports, stress contour plots, and solver data into actionable CAD geometry recommendations. APJ 3D delivers premier simulation results interpretation India, providing conclusive safety factor validation and engineering redesign prescriptions.
Simulation Alone Doesn't Make Decisions
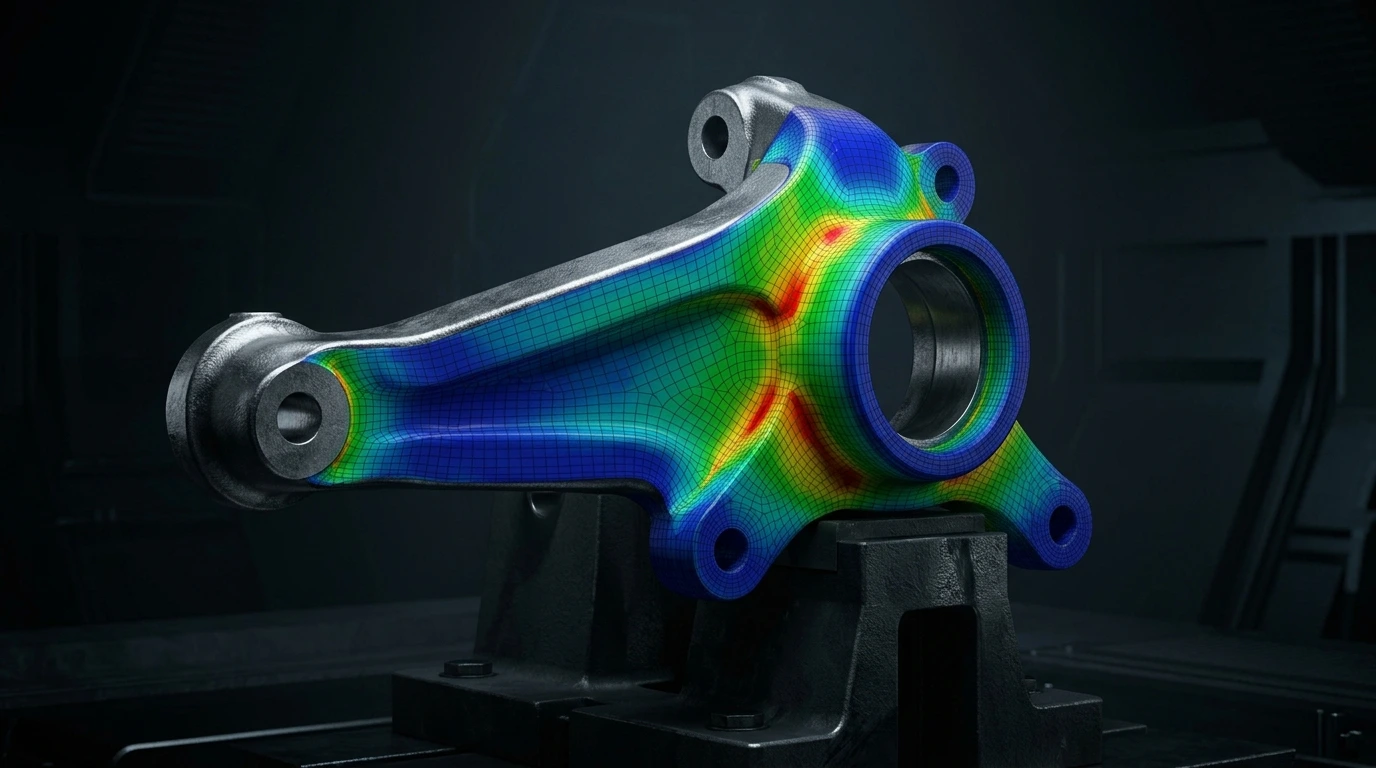
Raw color contours and solver numbers reveal where deformation occurs, but they never instruct design teams on how to reshape metal or polymer. We provide specialized CAE results engineering insights and expert FEA report engineering consulting.
Context & Material Reality
Differentiating between true structural yielding and artificial numerical singularities. We analyze localized strain hardening and material anisotropy.
Plausibility & Mesh Audit
Verifying whether element distortions, boundary over-constraints, or contact penetration skew the FEA report with structured consulting.
Actionable CAD Prescription
Providing explicit CAD instructions: adding stiffening ribs, relaxing fillet radii, and altering gauge thicknesses to eliminate stress hotspots.
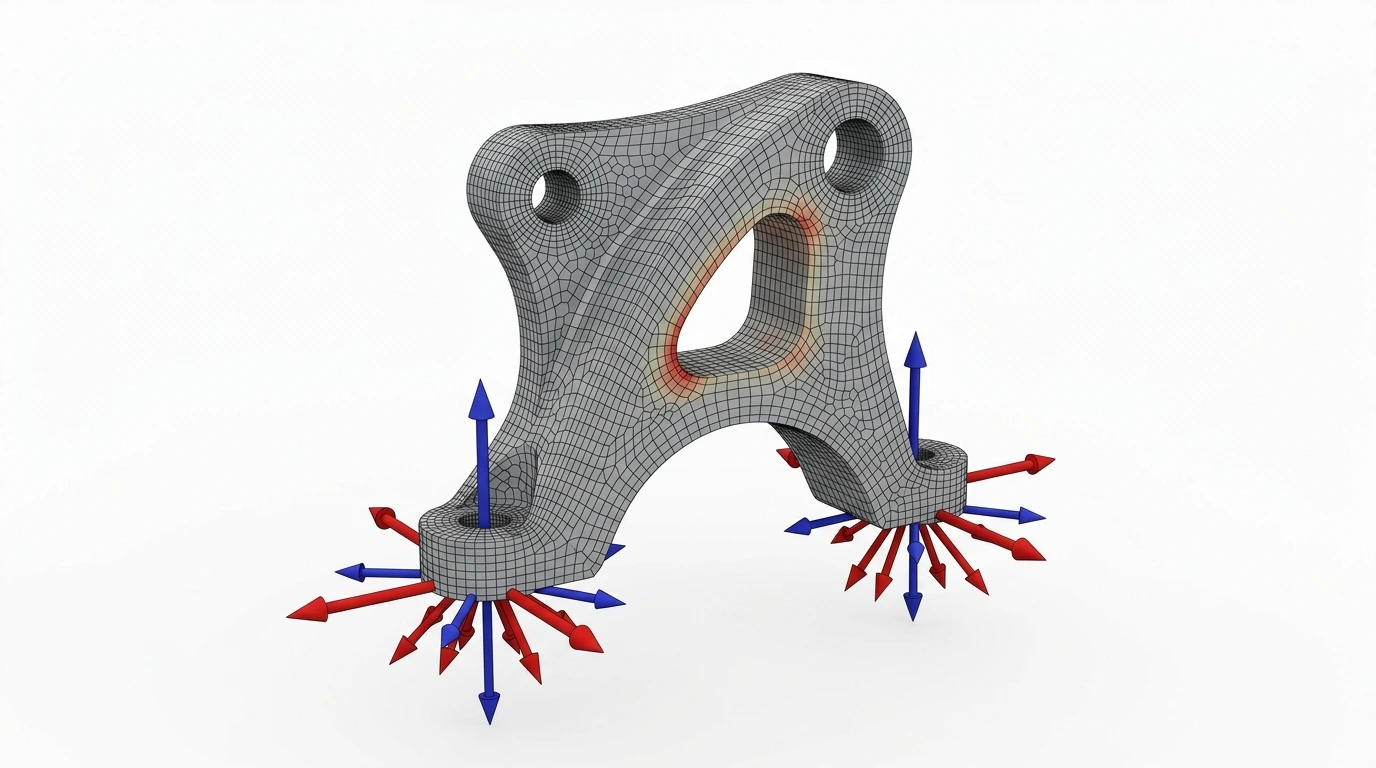
5-Stage Interpretation Methodology
Explore our sequential analytical workflow behind premier simulation results interpretation India projects.
We perform a rigorous audit of reaction forces and kinematic constraints, ensuring that rigid point supports do not generate non-physical stress spikes.
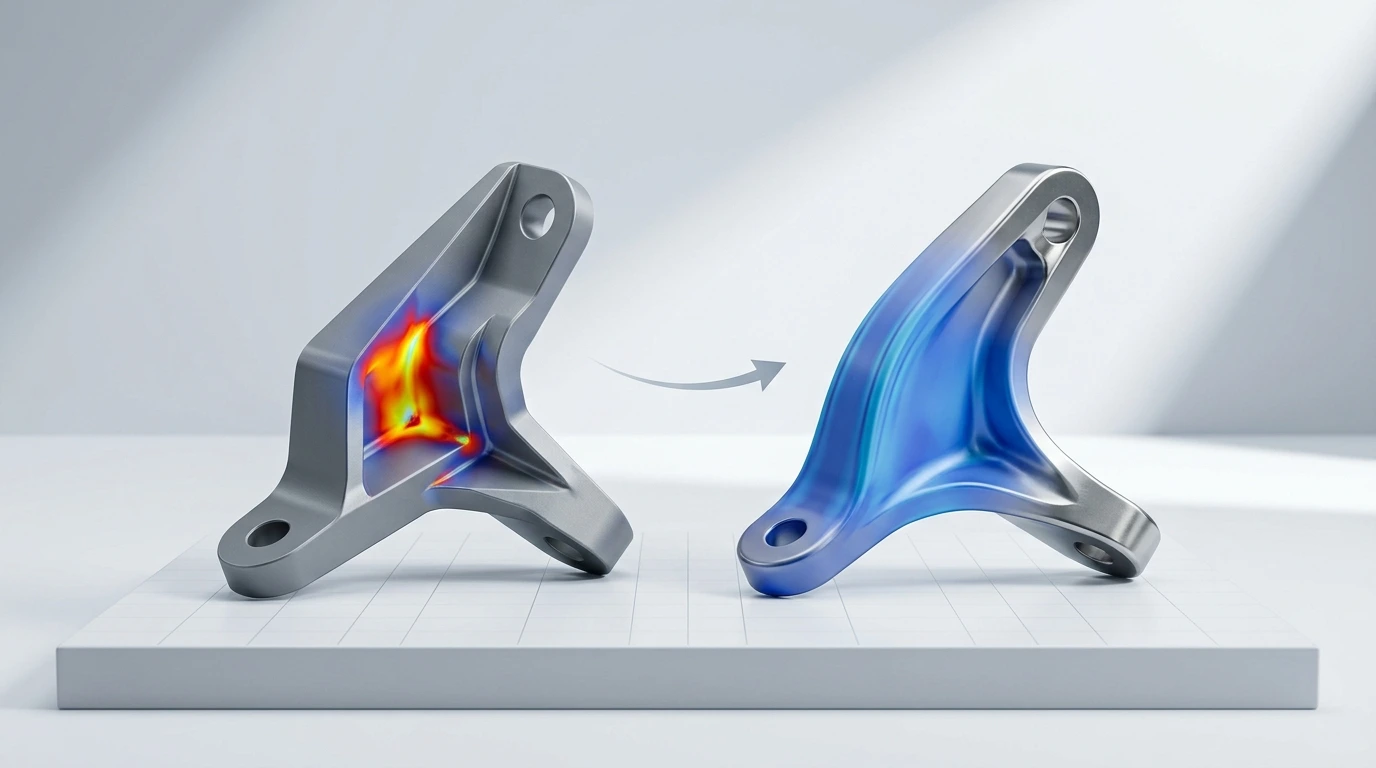
From Contour Plot to CAD Recommendation
Witness how rigorous engineering interpretation FEA transforms a high-stress component failure into an optimized, production-ready CAD geometry.
Localized plastic yielding at sharp 2.0mm internal pocket transition.
Smooth fillet geometry dissipates stress lines. Safety Factor increased to 1.85x.
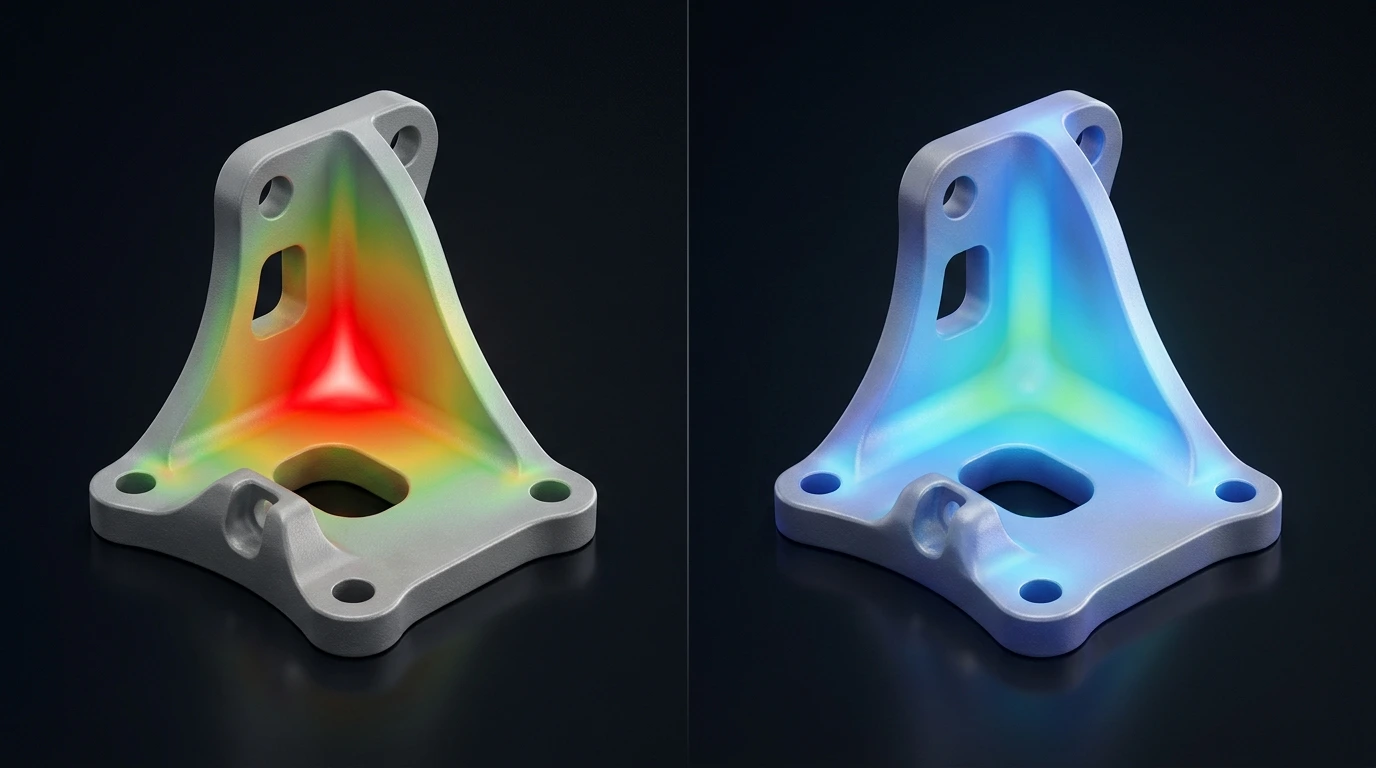
Multi-Load Case Engineering Synthesis
Real engineering structures never experience a single static force. Our advanced simulation data analysis service India synthesizes complex load envelopes to isolate true governing design criteria.
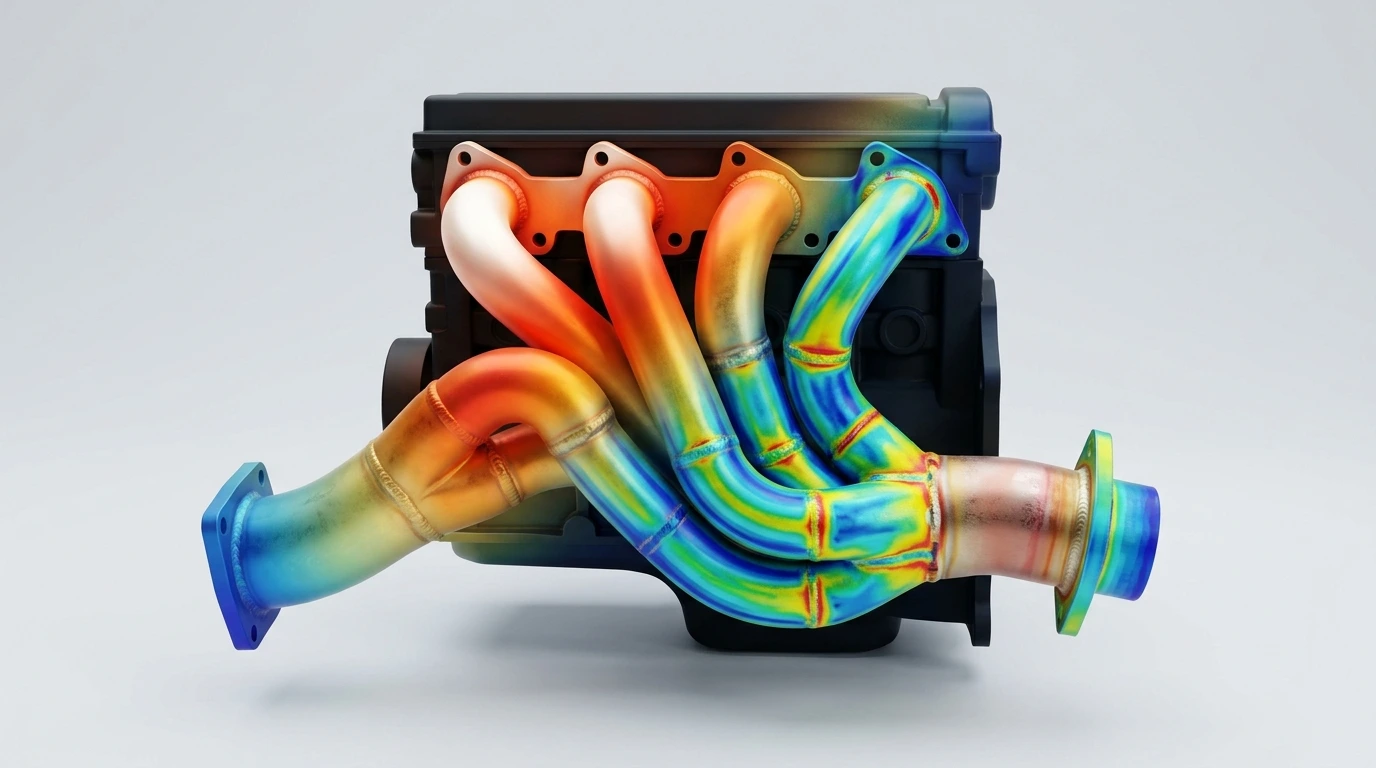
Engineering Decision Case Study
How APJ 3D interpreted raw FEA outputs for a Tier-1 heavy earthmoving equipment manufacturer, preventing a multi-million rupee field recall.
Client Field Fatigue Issue
Cracking observed at steering knuckle pivot arm after 1,200 hours of cyclic loading.
Simulation Output & Audit
Raw FEA reported 420 MPa peak stress near mounting boss; diagnosed as a point constraint singularity.
Geometry Redesign Success
Prescribed compound parabolic fillet; achieved 0 field failures across 5,000-hour extended test.
Industries & Who Uses This Service
Our interpretation consulting empowers cross-functional teams across India's top manufacturing sectors.
Stakeholder: Design Engineers
Why They Use Interpretation: They need direct answers on how much material to add or remove without learning complex finite element solver syntax.

What is Simulation Results Interpretation India?
CAE Simulation (FEA & CFD) is the numerical modeling of physical systems to predict structural stress, thermal dissipation, fluid flow, crashworthiness, and dynamic fatigue life under real-world operational loads.
When to Select This Service
Choose CAE simulation during early product development to virtually validate design integrity, optimize part weight, verify safety factors, and eliminate physical prototype failure risks before committing to production tooling.
Technical Capabilities & Verification Standards
Verified engineering parameters, hardware precision, and compliance benchmarks applied across all deliverables.
| Engineering Parameter | APJ 3D Capability & Precision Range | Compliance Standard / Verification |
|---|---|---|
| Simulation Disciplines | Linear/Non-Linear Structural FEA, Thermal Analysis, CFD Fluid Dynamics, Crash & Impact, Fatigue & Durability, NVH | ISO 9001 / NAFEMS Validated Procedures |
| Solvers & Software | ANSYS Mechanical, Abaqus, Altair HyperWorks/OptiStruct, Moldflow, OpenFOAM, LS-DYNA | High-Performance Computing (HPC) Clusters |
| Material Models | Elastic-Plastic metals, Hyperelastic rubbers, Composites, Viscoelastic polymers, Temperature-dependent curves | Tested Material Property Databases |
| Mould Flow Capabilities | Fill time, injection pressure, weld line prediction, sink marks, cooling circuit efficiency, volumetric shrinkage & warpage | Autodesk Moldflow Insight Validated |
| Deliverables | Comprehensive Engineering Reports, Von Mises Stress Plots, Factor of Safety (FoS) Maps, Deformation Animations, Optimization STEPs | Actionable Design Recommendation Summaries |
| Model Scale | From precision micromixers and plastic clips up to full vehicle chassis and industrial equipment weldments | Multi-Million Degree-of-Freedom Meshes |
| Turnaround Time | 3 to 7 business days for standard FEA/CFD studies; 24–48h for urgent gate location & fill checks | Dedicated Senior CAE Analysts |
Frequently Asked Questions
What information is required to start an FEA or CFD simulation?
What information is required to start an FEA or CFD simulation?
How do you validate the accuracy of simulation results?
How do you validate the accuracy of simulation results?
How can Moldflow simulation save tooling costs for plastic parts?
How can Moldflow simulation save tooling costs for plastic parts?
Can you optimize parts for lightweighting and material reduction?
Can you optimize parts for lightweighting and material reduction?
What is included in the final simulation report?
What is included in the final simulation report?
Turn Simulation Outputs into Confident Engineering Decisions
Don’t let ambiguous stress contours delay tooling release. Upload your raw FEA plots or report summaries today for actionable geometry guidance from senior simulation specialists.