3-Wheeler Vehicle Benchmarking in India
Revealing competitor engineering decisions through teardown, dimensional analysis, material characterization, and competitive intelligence for ICE & EV commercial 3-wheelers across India.
The Three-Wheeler Segment Is Moving Fast.
Most Development Decisions Are Not.
Hover over the engineering evolution nodes to unlock historical benchmarking insights.
ICE Platform Era
Focus on cost reduction and basic durability.
Electric Disruption
Battery packaging, weight distribution, and range optimization.
CNG Expansion
Tank integration and thermal management challenges.
Next-Gen Mobility
Connected, autonomous-ready, and ultra-efficient platforms.
Why 3-Wheelers Require A Different Approach
Structural Load Path Experience: Interact with the scanner track to visualize chassis stress distribution.
Awaiting structural interaction...
Chassis Torsion
Asymmetric stress distribution during dynamic cornering requires specialized tubular reinforcement absent in 4-wheeler platforms.
Payload Behaviour
Rear-biased payload structures demand adaptive suspension mounting points to manage severe longitudinal weight transfer.
Suspension Loading
Front fork assemblies experience distinct lateral forces during braking, necessitating custom rake and trail geometries.
AIS Compliance Zones
Mandatory crash safety and rollover protection standards dictate specific high-tensile steel integration zones.
Three Wheeler Automotive Analysis
Chassis, Load Path & Structural Geometry
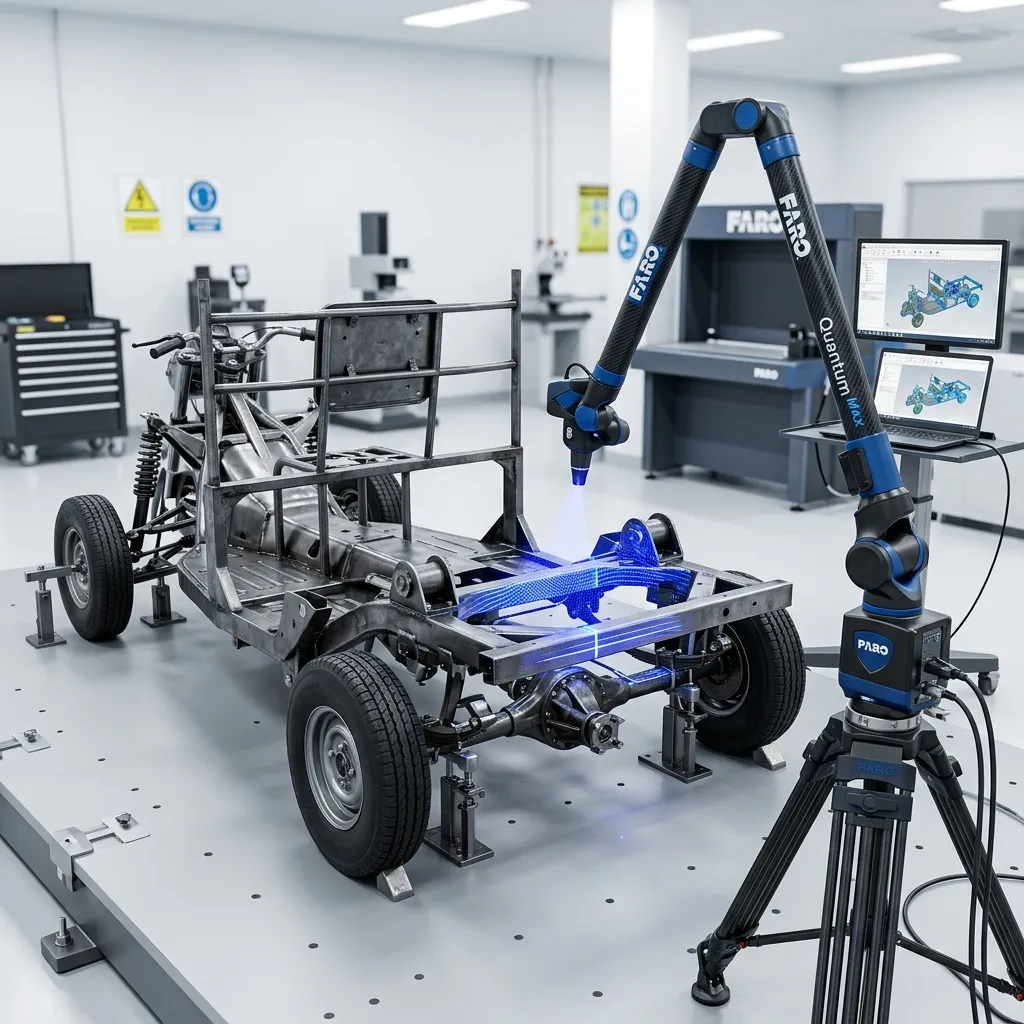
Precision CMM scanning and teardown inspection
Frame Analysis
- Tube Geometry & Bending
- Wall Thickness Mapping
- Weld Strategy & Quality
- Cross Members Positioning
Engineering Findings
- Weight Reduction Targets
- Stiffness Improvements
- Manufacturing Efficiency
- Cost Reduction Opportunities
3-Wheeler Teardown Engineering Services
Hover to expand the engineering focus area.
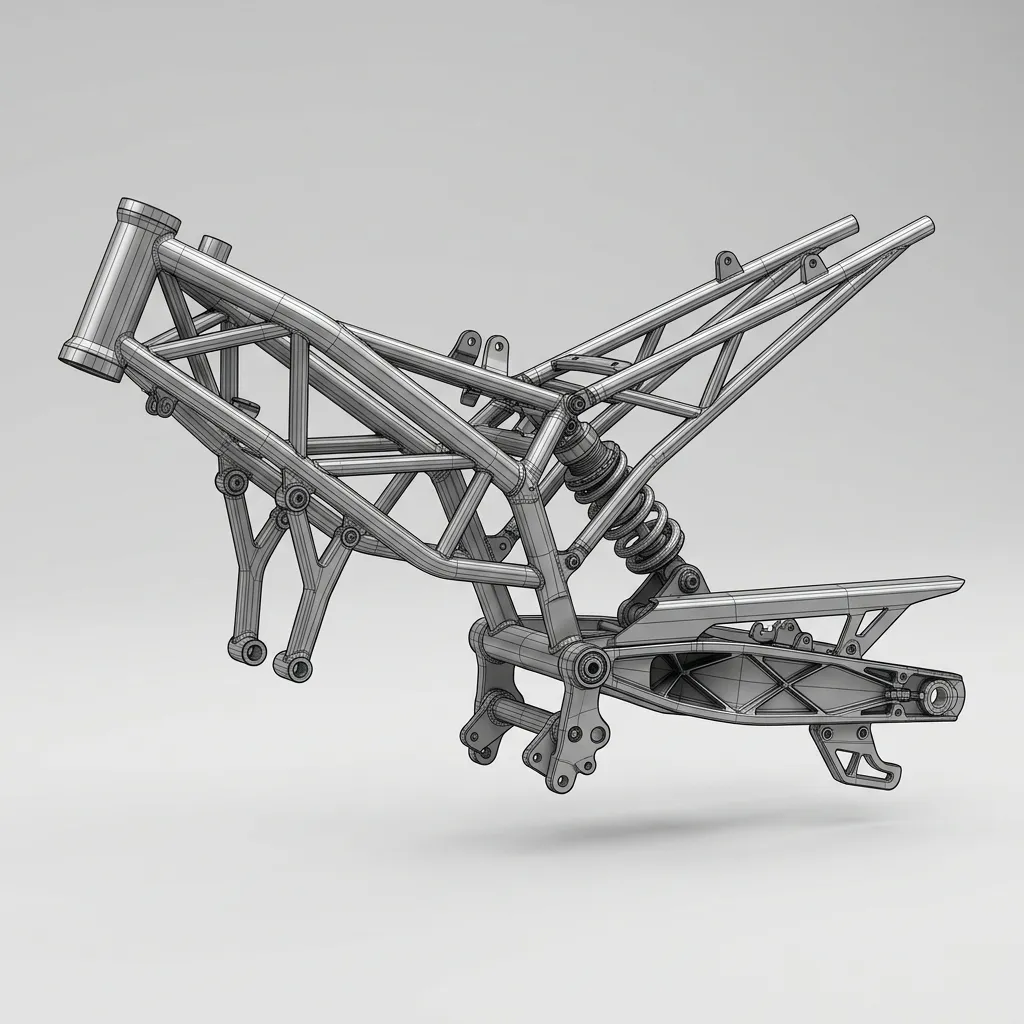
ICE + CNG Benchmarking
- Engine Mounting & NVH
- Transmission Efficiency
- Differential Assembly
- CNG Cylinder Integration
- Exhaust Routing
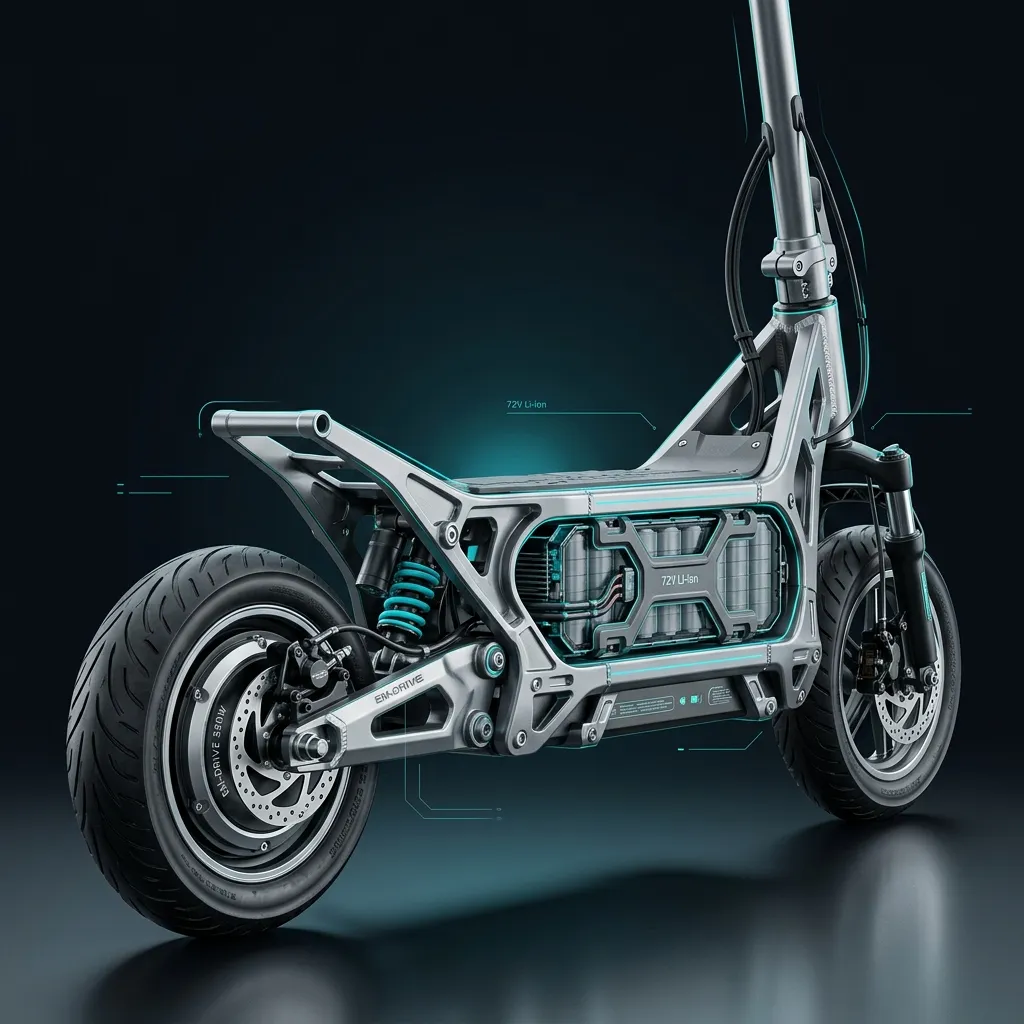
EV Benchmarking
- Motor Mounting & NVH
- Battery Pack Integration
- Thermal Management Systems
- BMS Architecture & Wiring
- Charging System & Ports
Auto Rickshaw Benchmarking Consulting
Passenger & Goods Teardown Priorities
Drag the handle to compare structural focus areas across segments.
Three Wheeled Vehicle Competitive Study
Teardown Data Into Development Targets
Select equation steps to view competitor engineering target formulation.
17% Lower Chassis Mass
Cross Member Optimization
-12kg Weight Reduction
High Torsional Rigidity
Weld Point Consolidation
+15% Stiffness Increase
Superior NVH Isolation
Advanced Motor Mounts
NVH Benchmarked to Top Tier
What is 3 Wheeler Vehicle Benchmarking Services?
Competitive Benchmarking and Should-Costing is the structured physical disassembly, material identification, process cycle-time estimation, and bottom-up cost modeling of competitor products and vehicle subsystems.
When to Select This Service
Choose teardown and should-costing when seeking actionable VAVE cost-reduction roadmaps (typically 10%–25% savings), supplier quotation validations, or competitive product intelligence.
Technical Capabilities & Verification Standards
Verified engineering parameters, hardware precision, and compliance benchmarks applied across all deliverables.
| Engineering Parameter | APJ 3D Capability & Precision Range | Compliance Standard / Verification |
|---|---|---|
| Benchmarking Scope | Full Vehicle Teardown (EV/ICE), Subsystems, Powertrains, Battery Packs, Industrial Equipment, Home Appliances | Standardized AIAG / VAVE Protocols |
| Costing Methodology | Bottom-Up Should-Costing (Raw material + Cycle time + Machine rates + Tooling amortization + SG&A/Profit) | Global & Indian Cost Databases |
| Material Characterization | Spectroscopy (OES/XRF), Polymer FTIR, Hardness Testing, Tensile & Microstructure Evaluation | NABL Accredited Lab Verification |
| Deliverables | Teardown Photo Books, Digital Bill of Materials (BOM), Should-Cost Models (Excel), VAVE Idea Roadmaps, CAD Assemblies | Complete Digital Teardown Portals |
| Typical Cost Savings | 10% to 25% achievable component cost reduction through DFM/VAVE recommendations | High-ROI Engineering Insights |
| Facility Capability | Dedicated 15,000+ sq.ft. Secure Vehicle & Subsystem Teardown Bays in Hosur & Chennai | NDAs & High-Security Protocols |
| Turnaround Time | 1 to 3 weeks for subsystem teardown and comprehensive should-cost models | Turnkey Benchmarking Programs |
Frequently Asked Questions
What is included in a product teardown report?
What is included in a product teardown report?
How does should-costing help in supplier negotiations?
How does should-costing help in supplier negotiations?
What is VAVE and how do you generate savings ideas?
What is VAVE and how do you generate savings ideas?
Can you benchmark electric vehicle (EV) battery packs and powertrains?
Can you benchmark electric vehicle (EV) battery packs and powertrains?
How do you maintain confidentiality and intellectual property during teardowns?
How do you maintain confidentiality and intellectual property during teardowns?
Need Competitive Benchmarking for Your Vehicles?
From Complete Vehicle Teardowns to Subsystem Cost Analysis — APJ 3D Delivers Actionable Engineering Intelligence Across India.