Automotive Performance & Engineering Benchmarking
Rigorous dynamic, structural, and aerodynamic benchmarking services for automotive OEMs in India. Gain measured competitor intelligence across NVH, crashworthiness, durability, thermal management, and vehicle dynamics.
Your Internal Test Data Tells You What Your Vehicle Does.
Benchmarking Tells You Whether That Is Good Enough.
Hover over the analysis below to reveal the competitive gap.

Internal Testing Data
Competitive Reality
The Benchmarking Ecosystem
Explore our comprehensive performance testing domains. Hover over a node to view specific metrics.
Performance
Noise, Vibration & Harshness (NVH)
Evaluating acoustic comfort and structural vibration transfer paths across the vehicle.
Key Metrics Analysed
- Engine Mount Isolation Efficiency
- Cabin Wind Noise Index
- Road Induced Body Vibration
- HVAC Acoustic Performance
What We Actually Measure
Select a test discipline to explore the engineering metrics we capture from competitor vehicles.
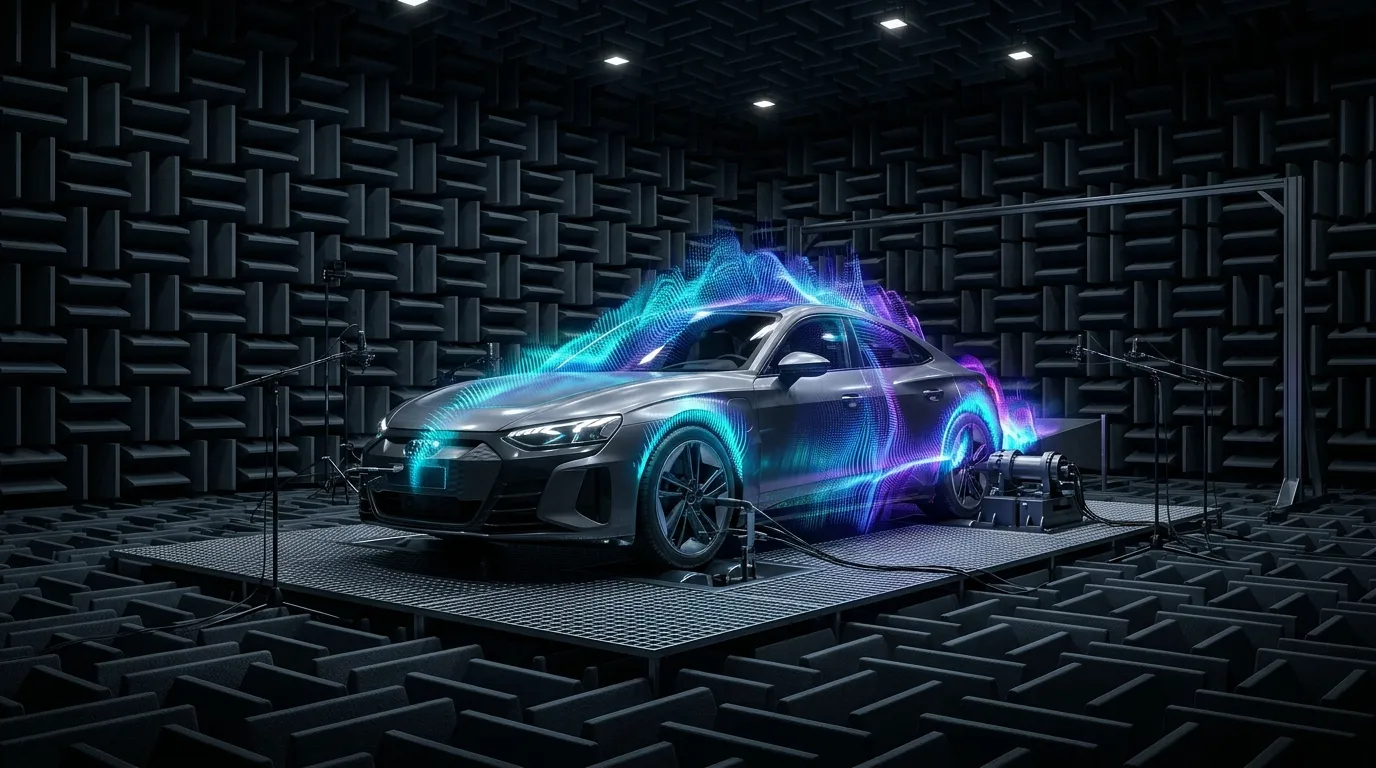
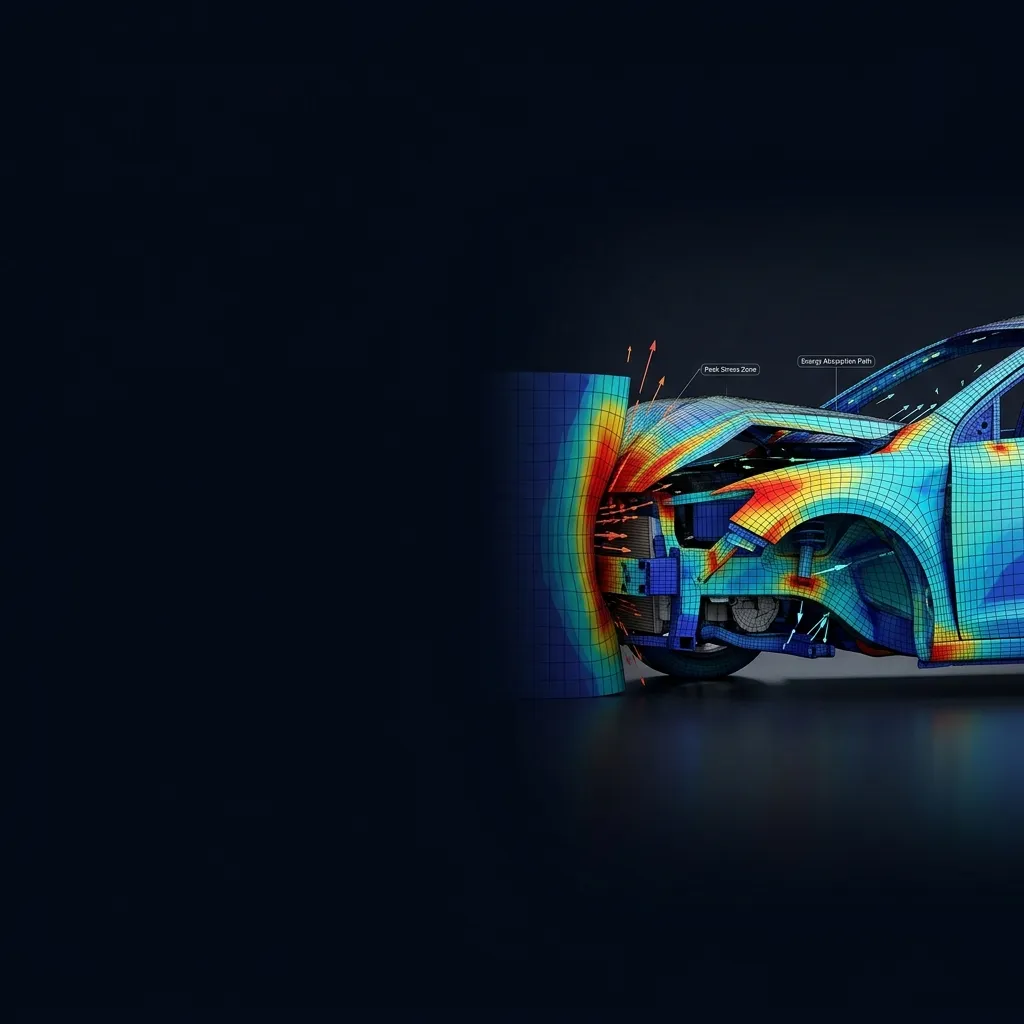
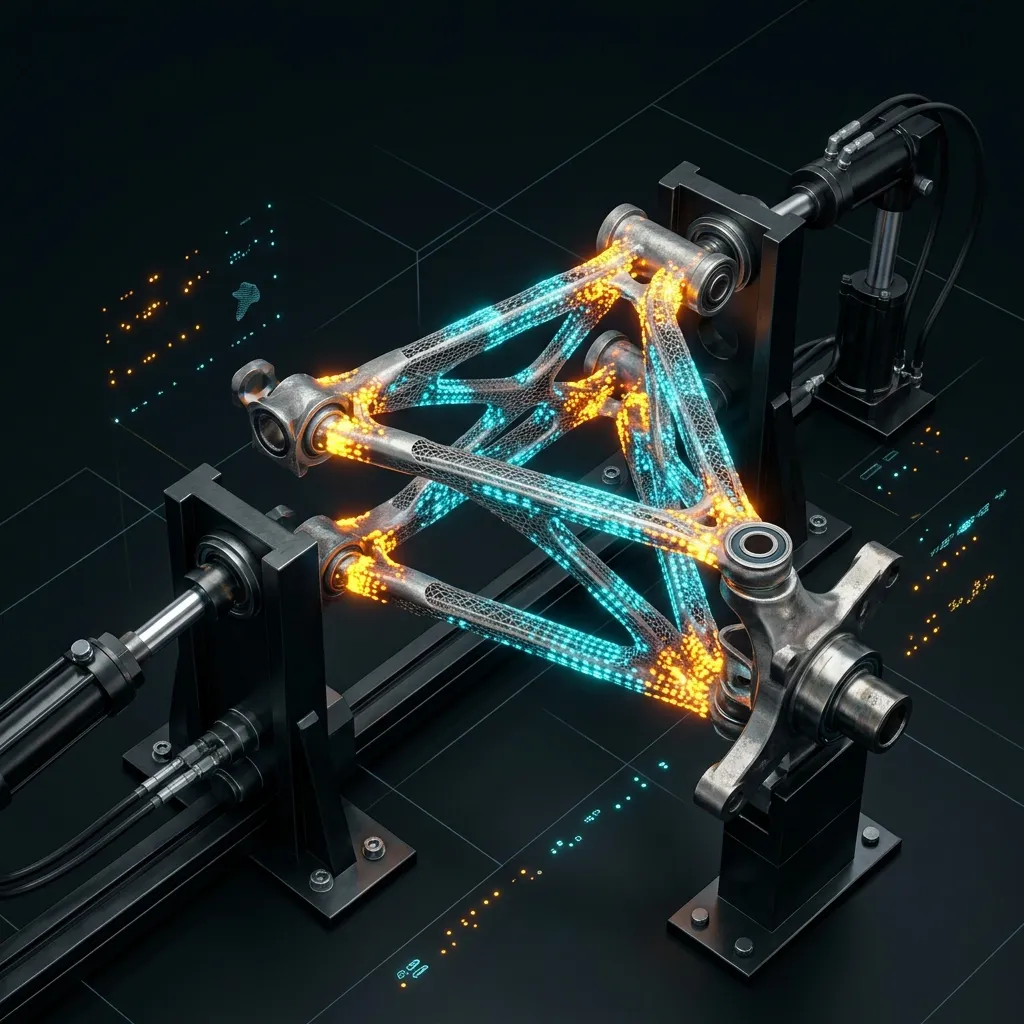
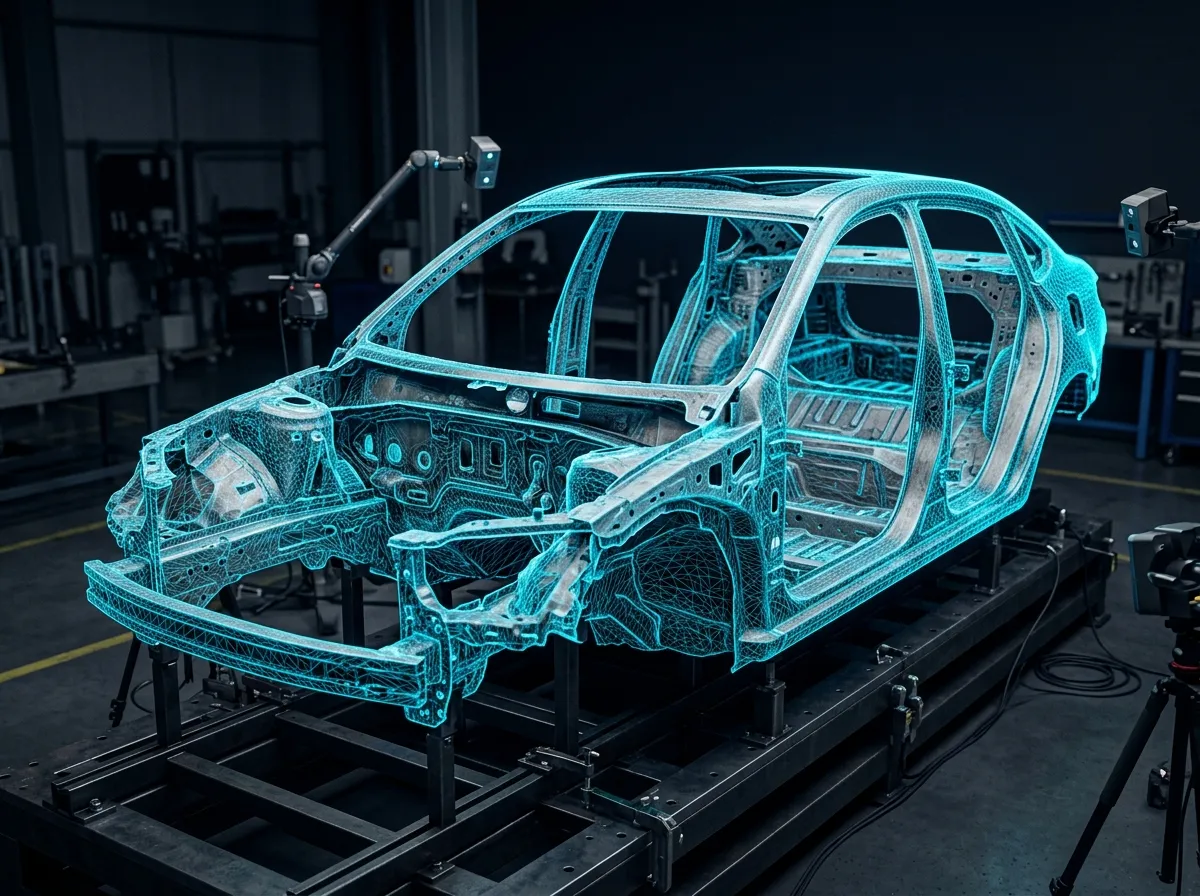
From Performance Gap to Engineering Fix
Our reports don't just identify what is wrong. They cascade the root cause all the way to a specific engineering decision.
Observed Performance Gap
Competitor cabin is 2.7dB quieter at 120km/h
Physical Teardown Finding
Double-sealed door frame with asymmetric rubber profile
Scan Data Finding
Door-to-body gap tolerance is ±0.4mm vs your ±0.8mm
Tooling Change
Door hemming die precision upgrade
Material Spec
Dual durometer seal compound sourcing
Cost Impact
+₹180/vehicle → NVH parity vs leader
When to Benchmark in Your Programme
Benchmarking impact varies by vehicle programme phase. Earlier engagement delivers higher ROI. Hover over each phase to see what decisions it unlocks.
Hover over a phase
See what benchmarking unlocks at each programme stage.
Why Benchmark With APJ 3D
Physical testing. 3D scan data. Engineering analysis. Benchmarking that goes beyond reports.

Full-Programme Support
From concept benchmarking to pre-SoP validation — intelligence at every gate.
Test-to-CAD Outputs
Native CAD, scan meshes, and annotated drawings — not just PDF reports.
Strict NDA Compliance
Secure protocols and total confidentiality on next-generation benchmarks.
Physical + Digital
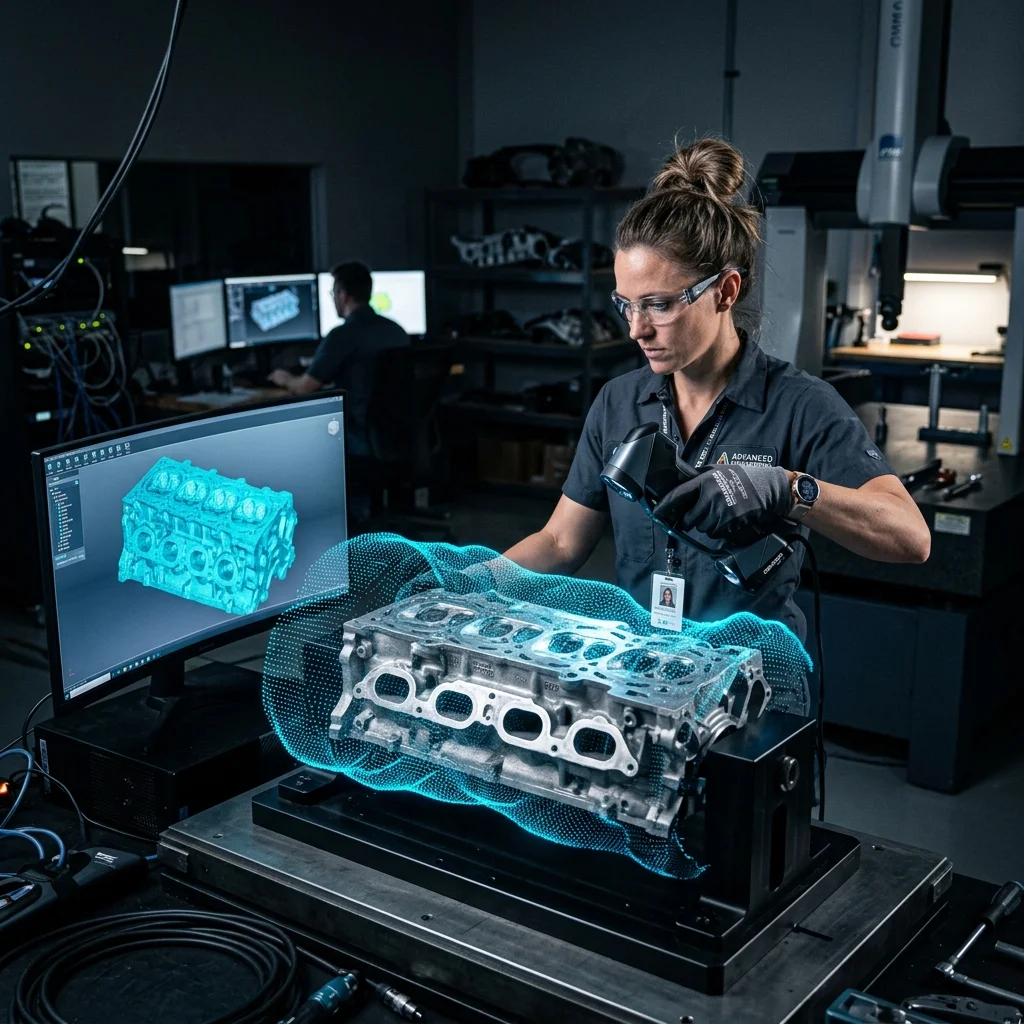
Teardown + 3D scanning + CMM + NVH — combined in one benchmarking engagement.
VAVE-Ready Intelligence
Cost-saving opportunity matrix aligned to your BOM — in every deliverable.
What is Automotive Performance and Engineering Benchmarking?
Competitive Benchmarking and Should-Costing is the structured physical disassembly, material identification, process cycle-time estimation, and bottom-up cost modeling of competitor products and vehicle subsystems.
When to Select This Service
Choose teardown and should-costing when seeking actionable VAVE cost-reduction roadmaps (typically 10%–25% savings), supplier quotation validations, or competitive product intelligence.
Technical Capabilities & Verification Standards
Verified engineering parameters, hardware precision, and compliance benchmarks applied across all deliverables.
| Engineering Parameter | APJ 3D Capability & Precision Range | Compliance Standard / Verification |
|---|---|---|
| Benchmarking Scope | Full Vehicle Teardown (EV/ICE), Subsystems, Powertrains, Battery Packs, Industrial Equipment, Home Appliances | Standardized AIAG / VAVE Protocols |
| Costing Methodology | Bottom-Up Should-Costing (Raw material + Cycle time + Machine rates + Tooling amortization + SG&A/Profit) | Global & Indian Cost Databases |
| Material Characterization | Spectroscopy (OES/XRF), Polymer FTIR, Hardness Testing, Tensile & Microstructure Evaluation | NABL Accredited Lab Verification |
| Deliverables | Teardown Photo Books, Digital Bill of Materials (BOM), Should-Cost Models (Excel), VAVE Idea Roadmaps, CAD Assemblies | Complete Digital Teardown Portals |
| Typical Cost Savings | 10% to 25% achievable component cost reduction through DFM/VAVE recommendations | High-ROI Engineering Insights |
| Facility Capability | Dedicated 15,000+ sq.ft. Secure Vehicle & Subsystem Teardown Bays in Hosur & Chennai | NDAs & High-Security Protocols |
| Turnaround Time | 1 to 3 weeks for subsystem teardown and comprehensive should-cost models | Turnkey Benchmarking Programs |
Frequently Asked Questions
What is included in a product teardown report?
What is included in a product teardown report?
How does should-costing help in supplier negotiations?
How does should-costing help in supplier negotiations?
What is VAVE and how do you generate savings ideas?
What is VAVE and how do you generate savings ideas?
Can you benchmark electric vehicle (EV) battery packs and powertrains?
Can you benchmark electric vehicle (EV) battery packs and powertrains?
How do you maintain confidentiality and intellectual property during teardowns?
How do you maintain confidentiality and intellectual property during teardowns?
Need Engineering Data for Competitor Parts?
From BIW Structures to Complex Assemblies — APJ 3D Delivers Accurate Subsystem Benchmarking and Scan-to-CAD Services Across India.