Automotive Cost, Weight & Value Benchmarking
Our Vehicle Should-Cost and Weight Analysis Service India transforms teardown data into engineering economics. Where should you spend money, where should you remove weight, and where should you do both?
Targets without benchmarking are assumptions.
Comparing internal design aspirations with measurable competitive reality.
Internal Targets
- Cost Reduction Goal
- Weight Reduction Goal
- Supplier Estimates
Benchmark-Based Targets
- Measured Weight Data
- Physical Teardown
- Component Cost Models
Cost • Weight • Value Intelligence
The golden triangle of engineering economics. Focus on the structural intersections that maximize vehicle margin.
Component Cost Modeling
Bottom-up should-cost calculations across raw materials, manufacturing processes, and supplier tooling margins.
Topology & Material Analysis
FEA stress distribution and material substitution to trim unnecessary mass without compromising crash safety.
Value Analysis & Engineering
Strategic trade-off modeling aligning feature willingness-to-pay with manufacturing efficiency.
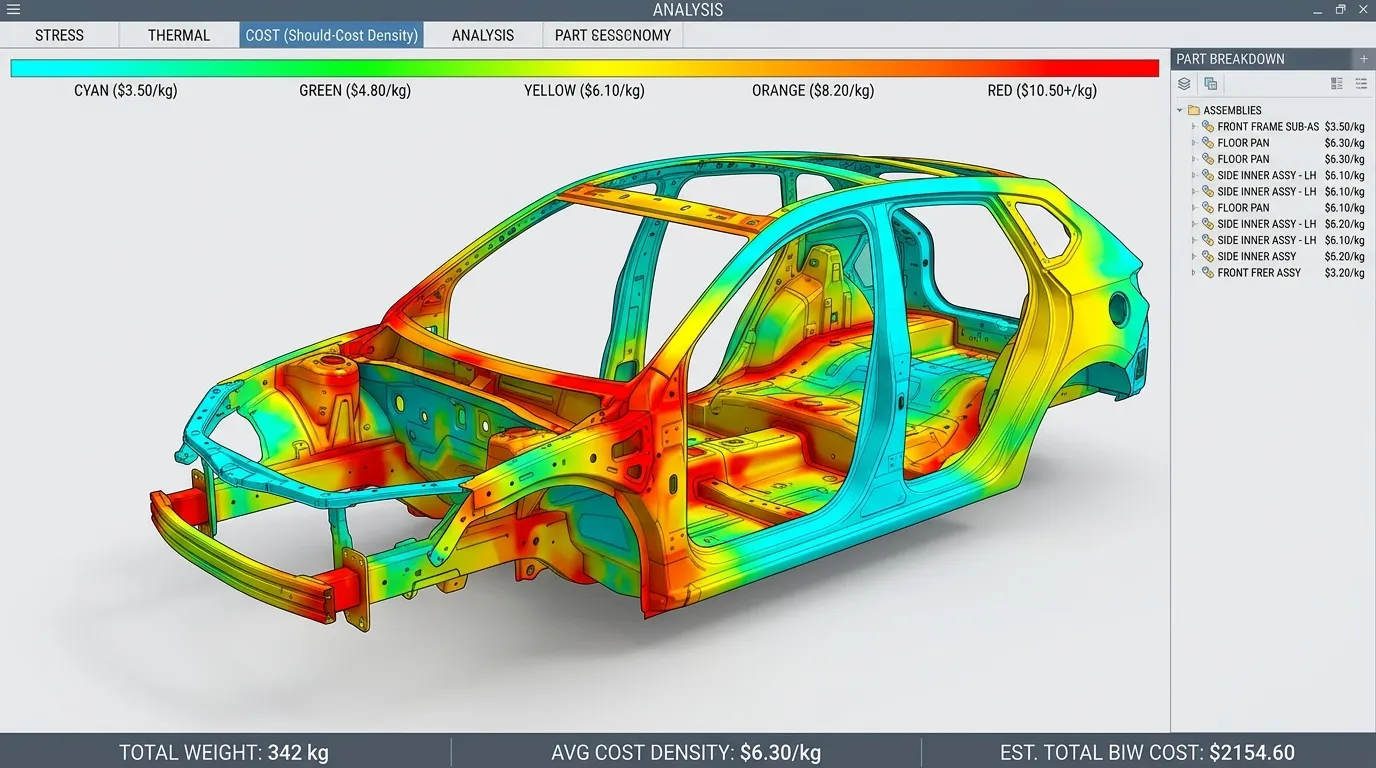
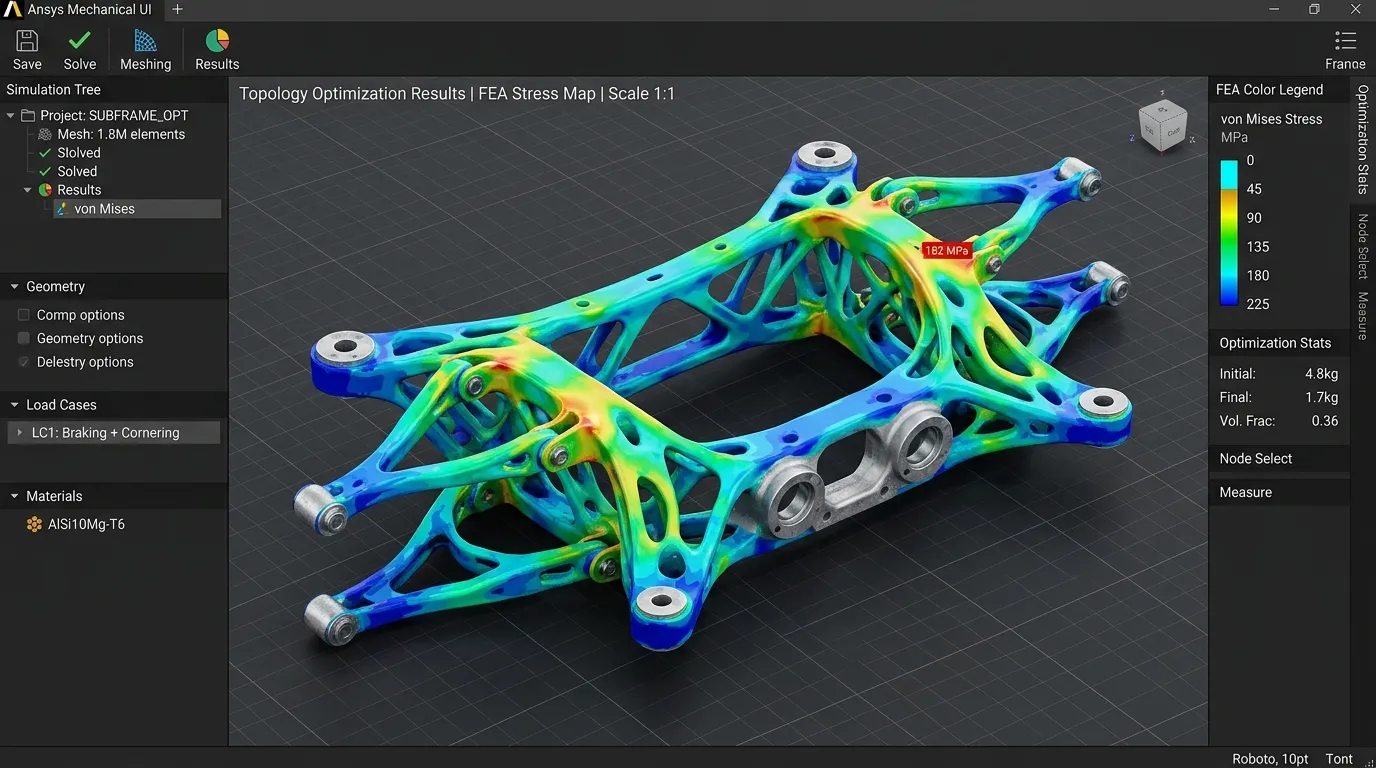
Benchmarking Engine Process Tunnel
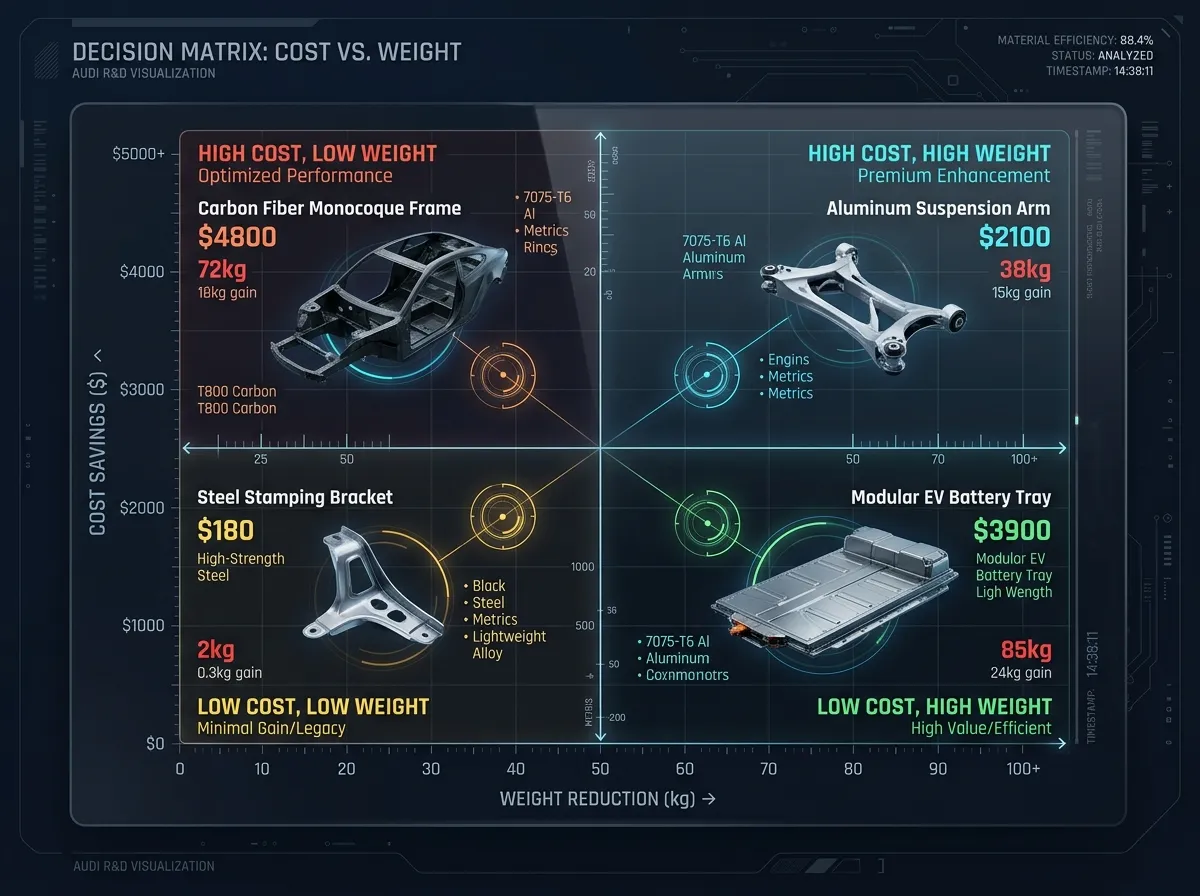
Cost vs Weight Decision Matrix
Isolate immediate engineering opportunities across 4 distinct quadrants.
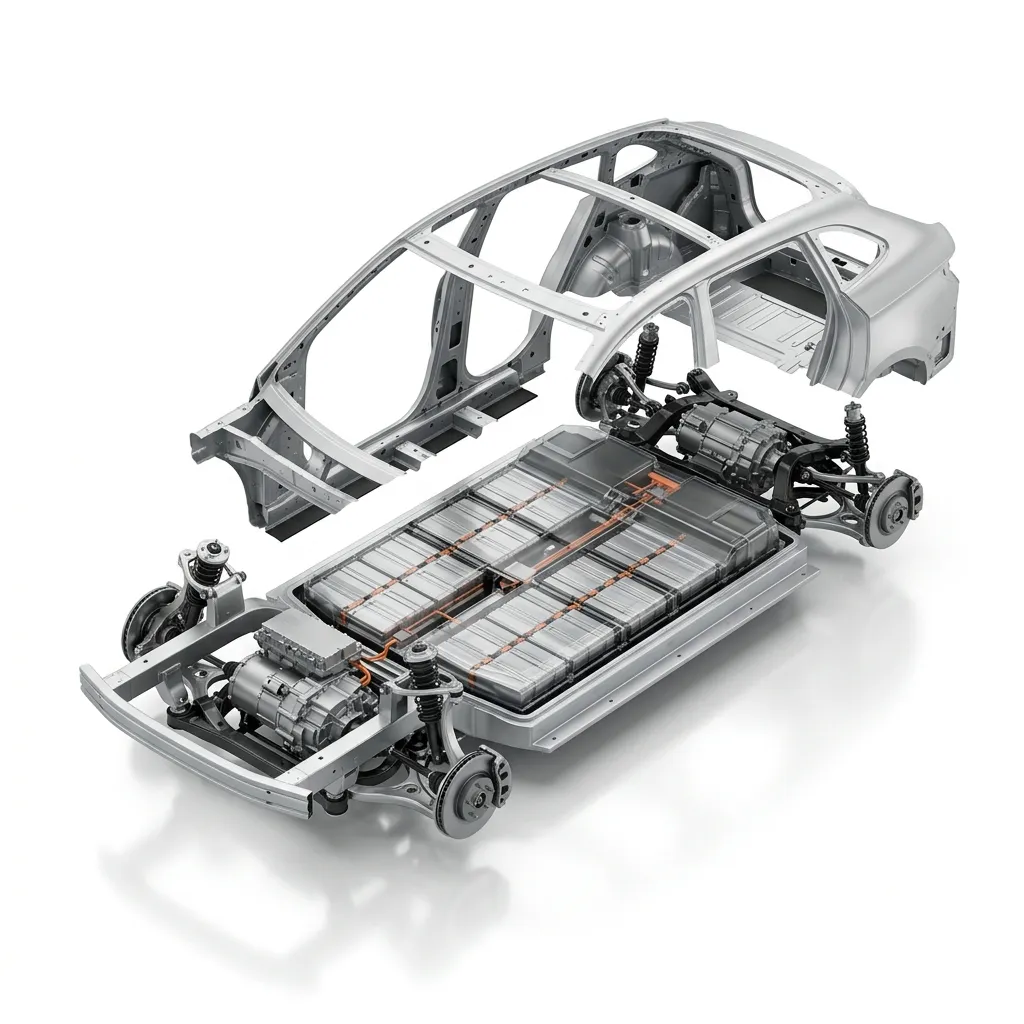
Live EV Mass & Cost Analysis Showcase
Vehicle Weight and Mass Comparison Service for OEM India. Visualizing weight and cost distribution.
VAVE Opportunity Command Center
Automotive VAVE and Cost Reduction Benchmarking India. Transform high-mass components into value-engineered assets.
Existing Design

Engineering Action Layer
- → Material change
- → Thickness optimization
- → Process change
- → Assembly simplification
Optimized Design
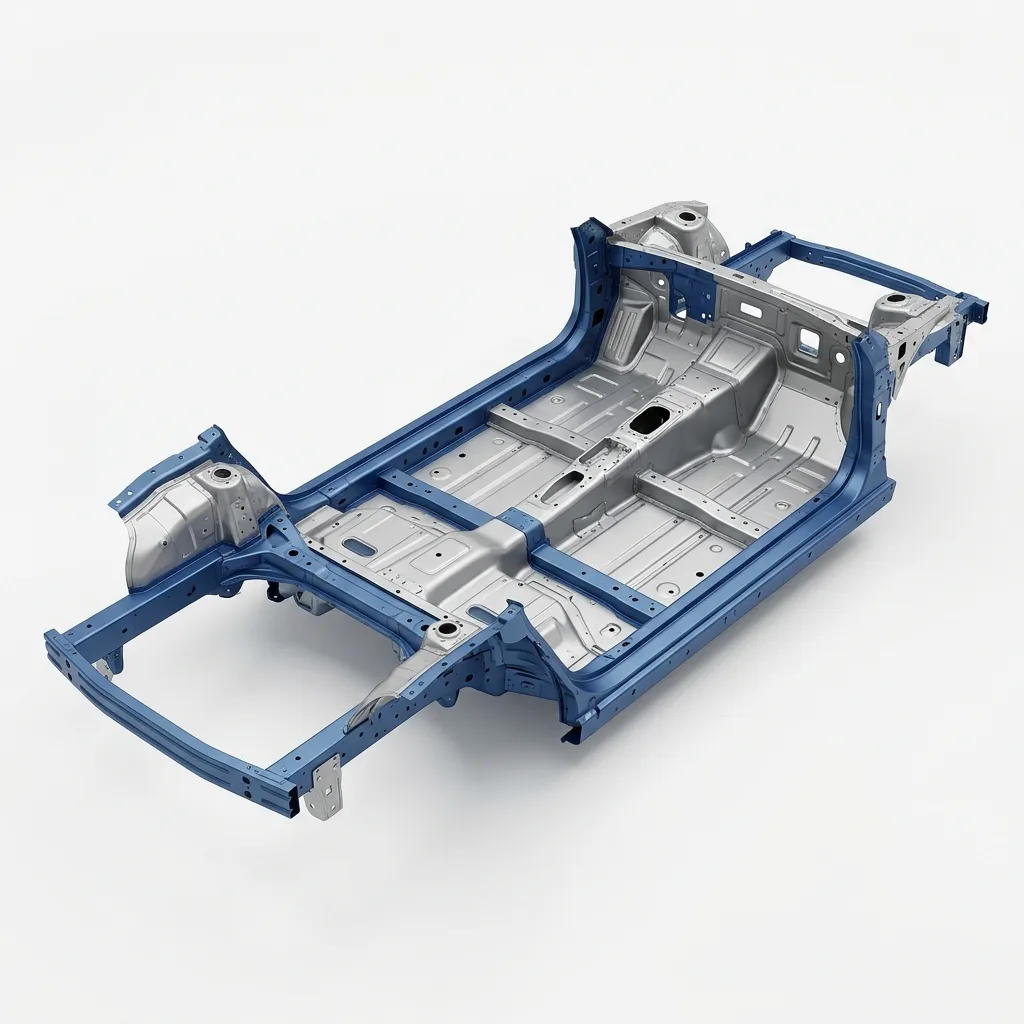
What is Cost Weight & Value Benchmarking Services India?
Competitive Benchmarking and Should-Costing is the structured physical disassembly, material identification, process cycle-time estimation, and bottom-up cost modeling of competitor products and vehicle subsystems.
When to Select This Service
Choose teardown and should-costing when seeking actionable VAVE cost-reduction roadmaps (typically 10%–25% savings), supplier quotation validations, or competitive product intelligence.
Technical Capabilities & Verification Standards
Verified engineering parameters, hardware precision, and compliance benchmarks applied across all deliverables.
| Engineering Parameter | APJ 3D Capability & Precision Range | Compliance Standard / Verification |
|---|---|---|
| Benchmarking Scope | Full Vehicle Teardown (EV/ICE), Subsystems, Powertrains, Battery Packs, Industrial Equipment, Home Appliances | Standardized AIAG / VAVE Protocols |
| Costing Methodology | Bottom-Up Should-Costing (Raw material + Cycle time + Machine rates + Tooling amortization + SG&A/Profit) | Global & Indian Cost Databases |
| Material Characterization | Spectroscopy (OES/XRF), Polymer FTIR, Hardness Testing, Tensile & Microstructure Evaluation | NABL Accredited Lab Verification |
| Deliverables | Teardown Photo Books, Digital Bill of Materials (BOM), Should-Cost Models (Excel), VAVE Idea Roadmaps, CAD Assemblies | Complete Digital Teardown Portals |
| Typical Cost Savings | 10% to 25% achievable component cost reduction through DFM/VAVE recommendations | High-ROI Engineering Insights |
| Facility Capability | Dedicated 15,000+ sq.ft. Secure Vehicle & Subsystem Teardown Bays in Hosur & Chennai | NDAs & High-Security Protocols |
| Turnaround Time | 1 to 3 weeks for subsystem teardown and comprehensive should-cost models | Turnkey Benchmarking Programs |
Frequently Asked Questions
What is included in a product teardown report?
What is included in a product teardown report?
How does should-costing help in supplier negotiations?
How does should-costing help in supplier negotiations?
What is VAVE and how do you generate savings ideas?
What is VAVE and how do you generate savings ideas?
Can you benchmark electric vehicle (EV) battery packs and powertrains?
Can you benchmark electric vehicle (EV) battery packs and powertrains?
How do you maintain confidentiality and intellectual property during teardowns?
How do you maintain confidentiality and intellectual property during teardowns?
Ready to Optimize Your Cost & Weight?
From Full Vehicle Teardowns to VAVE Analysis — APJ 3D Delivers Actionable Cost and Weight Reduction Strategies.