Bus & Coach Benchmarking Services in India
Premium engineering intelligence for passenger transport platforms. Deep dive into coach body structures, floor architecture, HVAC packaging, and vehicle teardown consulting across India.
Why Coaches Win Contracts
Before Engineers Know Why
Tracing high-level fleet operator decisions directly down to granular structural engineering advantages.
Fleet Evaluation Factors
Engineering Architecture
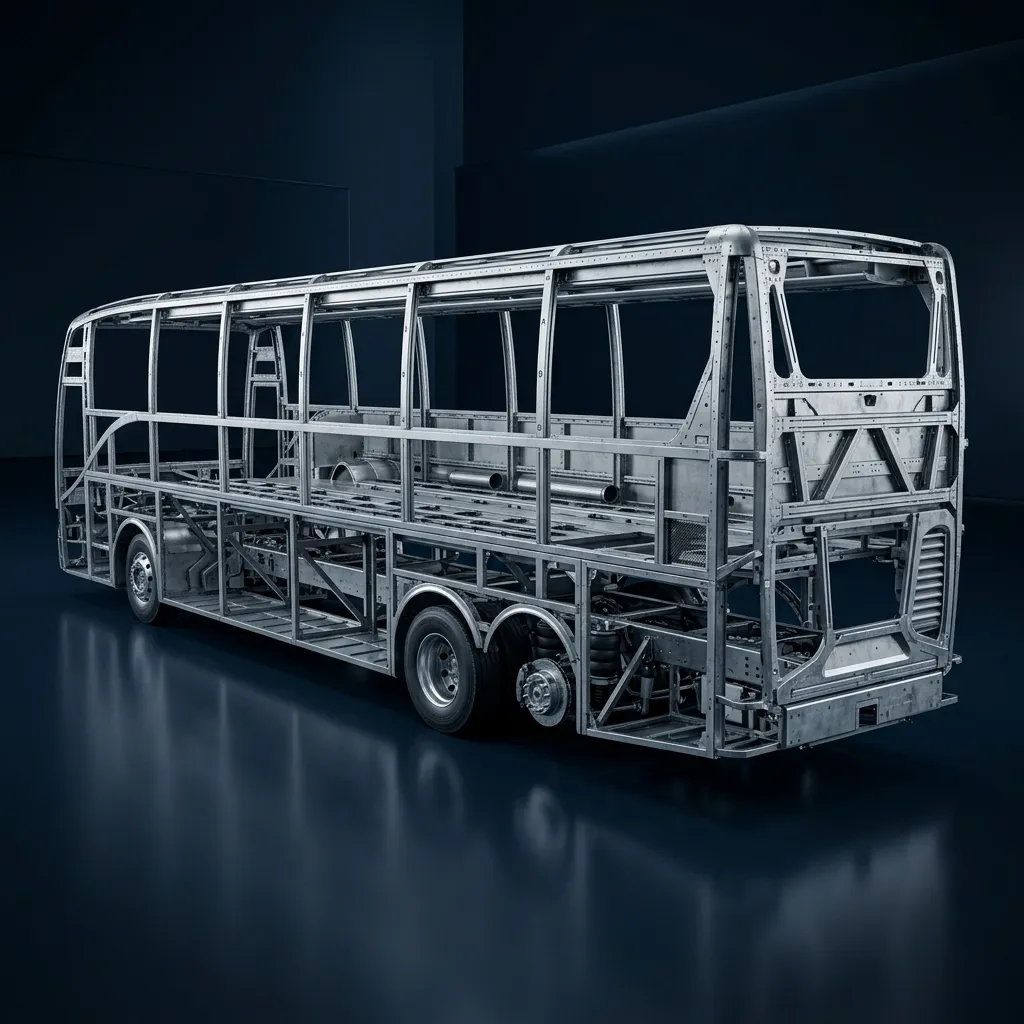
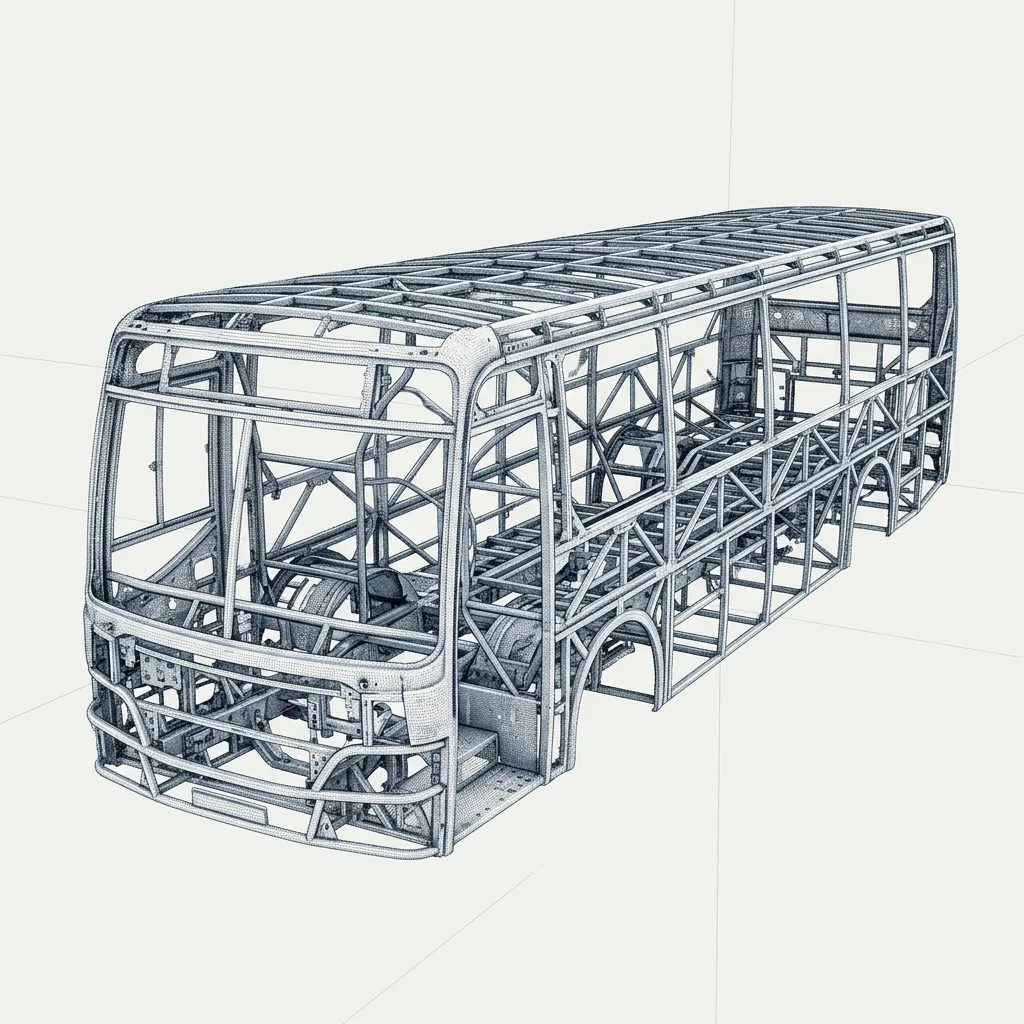
Structural Cage Benchmarking
Hover over structural nodes to reveal metrology-grade insights and teardown intelligence.
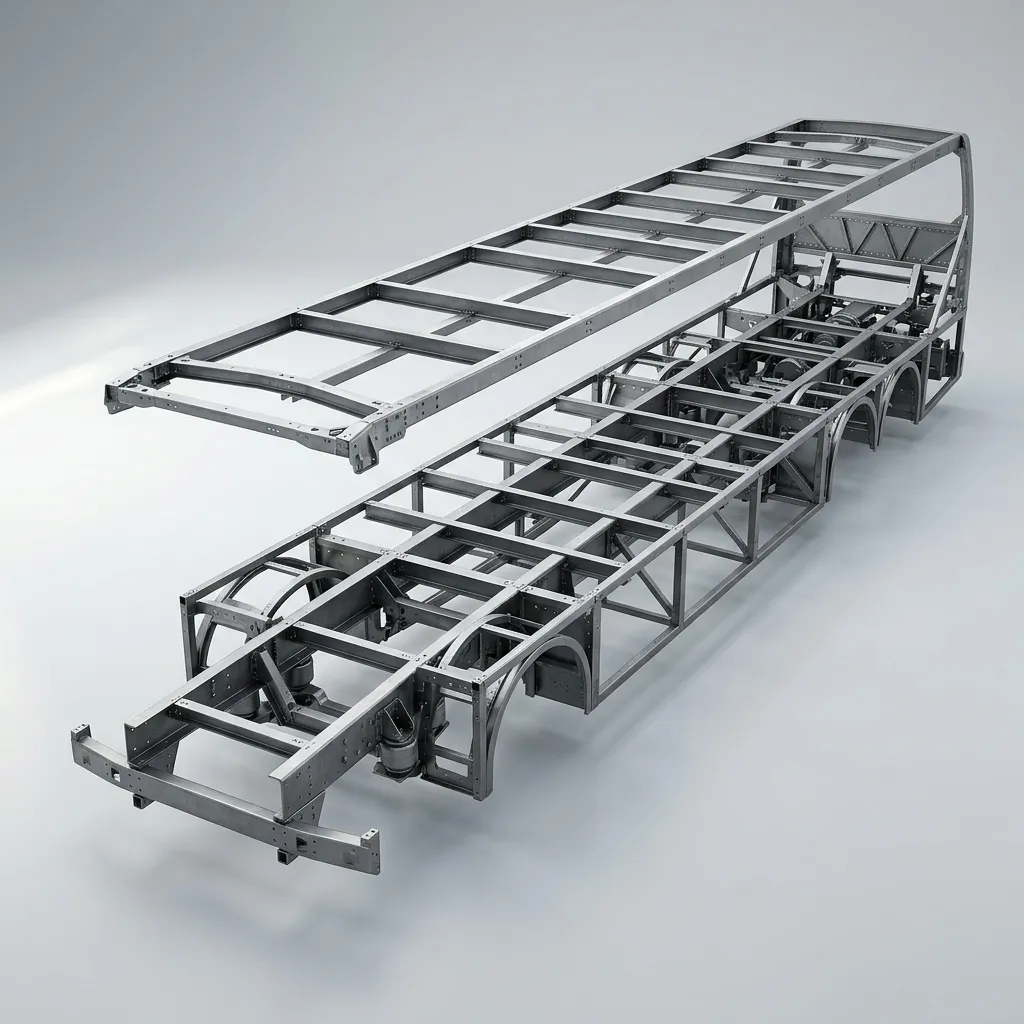
Floor Structure
Subframe Analysis
Cutting through the architecture layer by layer. The floor structure dictates luggage capacity, center of gravity, and NVH.
Cross Bearers & Joints
Analyzing weld penetration, joint gussets, and stress concentrations across lateral supports.
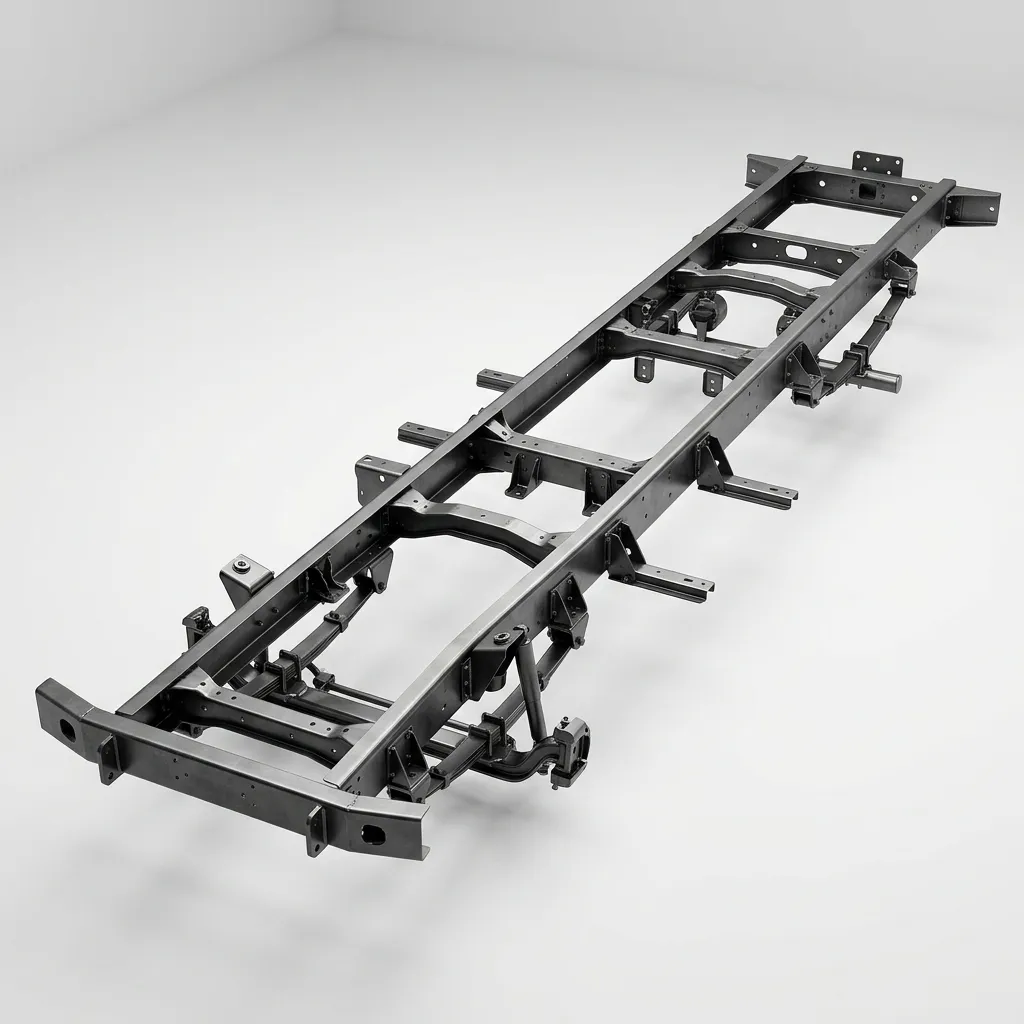
Longitudinal Stringers
Benchmarking material thickness and profile design for maximal longitudinal bending stiffness.
Underfloor Compartments
Optimizing luggage bay volume without compromising the structural loop geometry.
Low-Floor & Step Architecture
Entrance ergonomics, accessibility packaging, and suspension drop-center analysis.
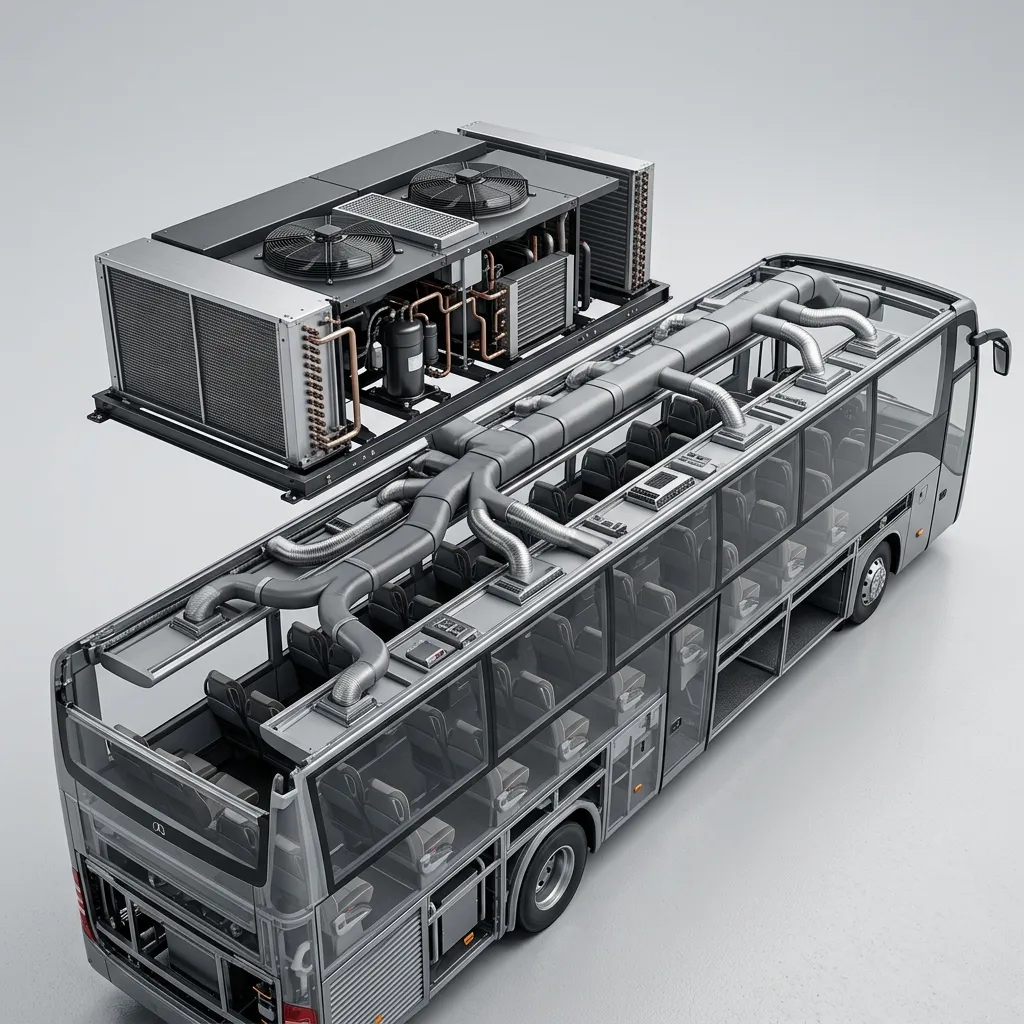
Passenger Systems Ecosystem
Integrating HVAC, glazing, and NVH to deliver the ultimate passenger experience.
HVAC Packaging
Roof-mounted airflow simulation and duct routing efficiency.
Glazing Geometry
Panoramic views balanced with solar heat gain reduction.
Seal Strategy
Acoustic barrier testing against wind and road noise.
Driver Cockpit
Ergonomic reach zones and visibility angle mapping.
Luggage Structure
Bay door kinematics and structural load paths.
Comfort Systems
Seating rail integrations and vibration isolation.
From Scan Data
to Competitive Decisions
The deliverables driving your next vehicle program.
Point Cloud Data
Sub-millimeter accurate 3D mesh of the entire coach architecture.
Structural Geometry Maps
Parametric CAD models capturing critical joint configurations.
Weight Comparison
Granular mass breakdown highlighting material optimization opportunities.
Packaging Analysis
Space utilization metrics for HVAC, fuel, and electrical routing.
Manufacturing Indicators
Tooling estimations and assembly sequence reverse engineering.
Design Change Reports
Actionable recommendations to reduce cost and increase lifecycle.
On-Site Benchmarking
Deployment
Bringing metrology-grade precision directly to your depot. We mobilize across India to capture massive coach structures where they sit.
- Chennai HQ
- Pune Node
- Bangalore Node
- Delhi NCR Node

What is Bus & Coach Benchmarking Services?
Competitive Benchmarking and Should-Costing is the structured physical disassembly, material identification, process cycle-time estimation, and bottom-up cost modeling of competitor products and vehicle subsystems.
When to Select This Service
Choose teardown and should-costing when seeking actionable VAVE cost-reduction roadmaps (typically 10%–25% savings), supplier quotation validations, or competitive product intelligence.
Technical Capabilities & Verification Standards
Verified engineering parameters, hardware precision, and compliance benchmarks applied across all deliverables.
| Engineering Parameter | APJ 3D Capability & Precision Range | Compliance Standard / Verification |
|---|---|---|
| Benchmarking Scope | Full Vehicle Teardown (EV/ICE), Subsystems, Powertrains, Battery Packs, Industrial Equipment, Home Appliances | Standardized AIAG / VAVE Protocols |
| Costing Methodology | Bottom-Up Should-Costing (Raw material + Cycle time + Machine rates + Tooling amortization + SG&A/Profit) | Global & Indian Cost Databases |
| Material Characterization | Spectroscopy (OES/XRF), Polymer FTIR, Hardness Testing, Tensile & Microstructure Evaluation | NABL Accredited Lab Verification |
| Deliverables | Teardown Photo Books, Digital Bill of Materials (BOM), Should-Cost Models (Excel), VAVE Idea Roadmaps, CAD Assemblies | Complete Digital Teardown Portals |
| Typical Cost Savings | 10% to 25% achievable component cost reduction through DFM/VAVE recommendations | High-ROI Engineering Insights |
| Facility Capability | Dedicated 15,000+ sq.ft. Secure Vehicle & Subsystem Teardown Bays in Hosur & Chennai | NDAs & High-Security Protocols |
| Turnaround Time | 1 to 3 weeks for subsystem teardown and comprehensive should-cost models | Turnkey Benchmarking Programs |
Frequently Asked Questions
What is included in a product teardown report?
What is included in a product teardown report?
How does should-costing help in supplier negotiations?
How does should-costing help in supplier negotiations?
What is VAVE and how do you generate savings ideas?
What is VAVE and how do you generate savings ideas?
Can you benchmark electric vehicle (EV) battery packs and powertrains?
Can you benchmark electric vehicle (EV) battery packs and powertrains?
How do you maintain confidentiality and intellectual property during teardowns?
How do you maintain confidentiality and intellectual property during teardowns?
Know Why the Competitor's Coach Costs Less, Weighs Less, & Lasts Longer
Bus and Coach Benchmarking Services providing ultimate competitive intelligence.