CAD to Part Comparison
Inspection Service India
Detect dimensional deviations, surface warping, GD&T non-conformities and assembly risks before they become production problems.
Traditional vs Modern Metrology
Visual Inspection
Surface looks acceptable to the naked eye. No visible defects or obvious warping detected.
CAD Comparison
High-resolution 3D point cloud superimposed over nominal CAD reveals non-linear warping.
What CAD to Part Comparison Actually Does
3D Scan Part
High-resolution point cloud capture.
Align with CAD
Best-fit or RPS datum alignment.
Surface Compare
Global deviation analysis.
GD&T Analysis
Checking flatness, true position, etc.
Final Report
Actionable engineering data.
When Visual Inspection Fails
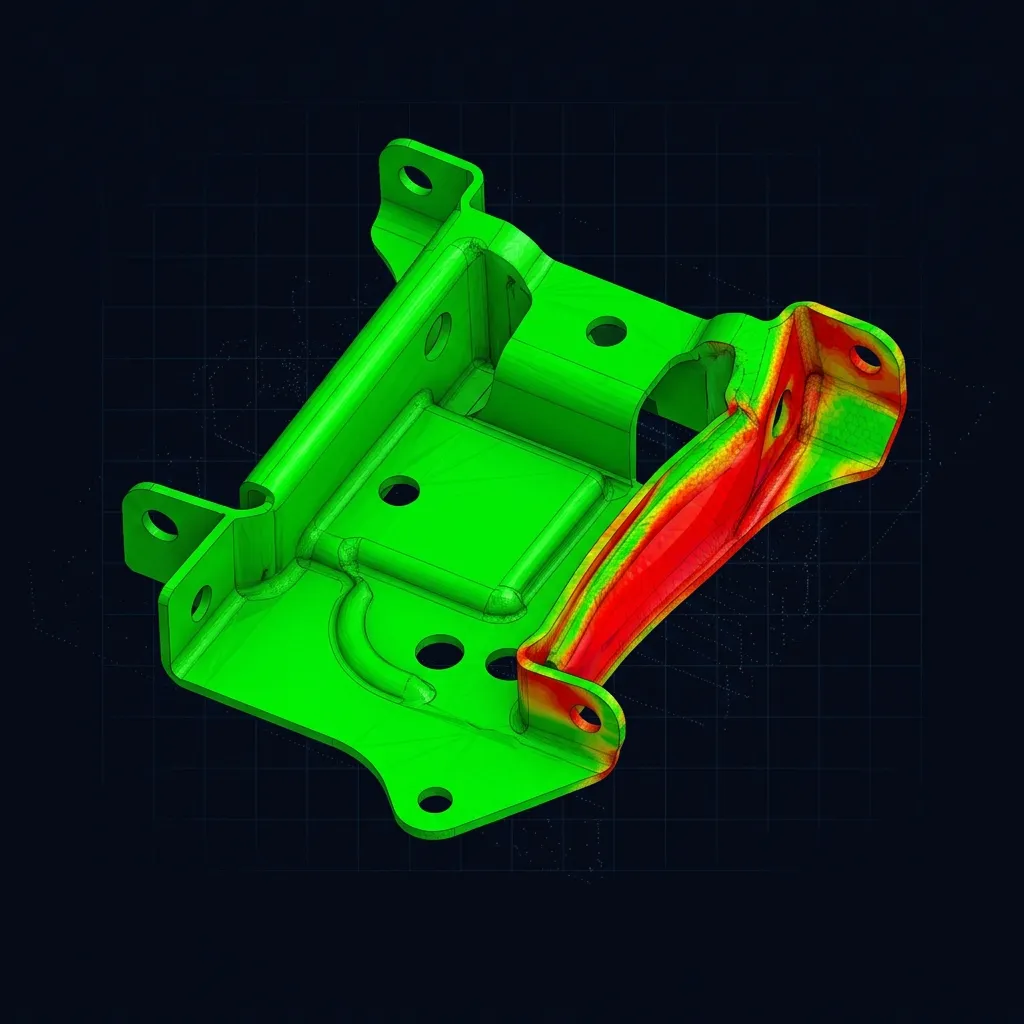
Root Cause Analysis
A critical sheet metal component passed standard gauge checks but failed to mate during assembly.
3D scanning and CAD comparison revealed a non-linear twist of +0.85mm across the mating flange—invisible to the naked eye but catastrophic to the assembly line.
When Do You Need Metrology?
Prototype Validation
Prove It Out
Verify your tooling and initial setup. Ensure the very first part matches the CAD design before authorizing mass production.
Tool Wear Monitoring
Track Degradation
Periodically scan parts from the batch to track tooling degradation, thermal shrinkage variations, and process drift over time.
Shipment Confidence
Undeniable Proof
Provide your customers with an undeniable digital inspection report proving the dispatched components are 100% within tolerance.
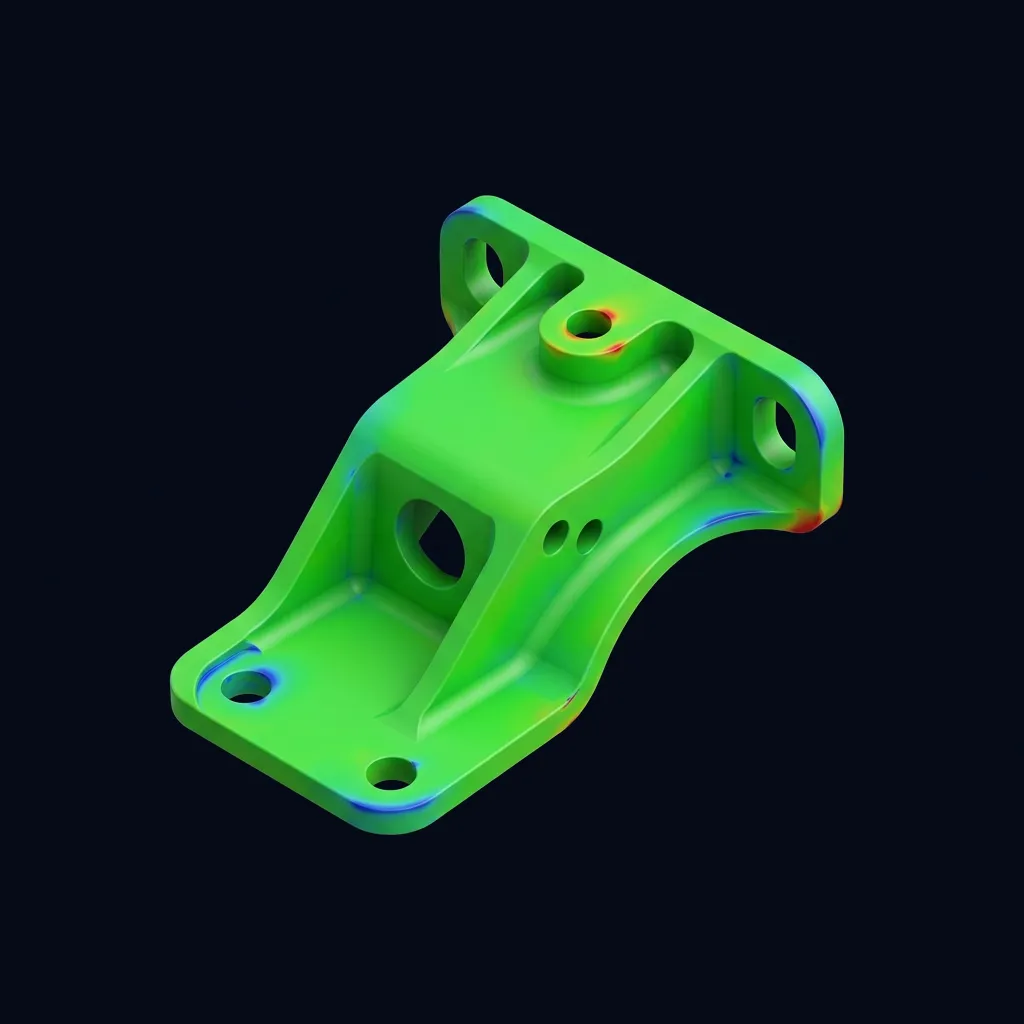
The Power of the Colour Map
Instantly see where your part is undersized (blue), oversized (red), or within tolerance (green). Our high-resolution colour maps provide clear, actionable insights into dimensional accuracy without complex spreadsheets.
What Your Report Includes
01. Colour Deviation Map
A global visual representation of surface geometry differences.
02. Dimensional Deviation
Exact measurements between critical features vs nominal CAD.
03. GD&T Analysis
Validation of complex tolerances like true position and flatness.


What is CAD to Part Comparison Inspection Service India?
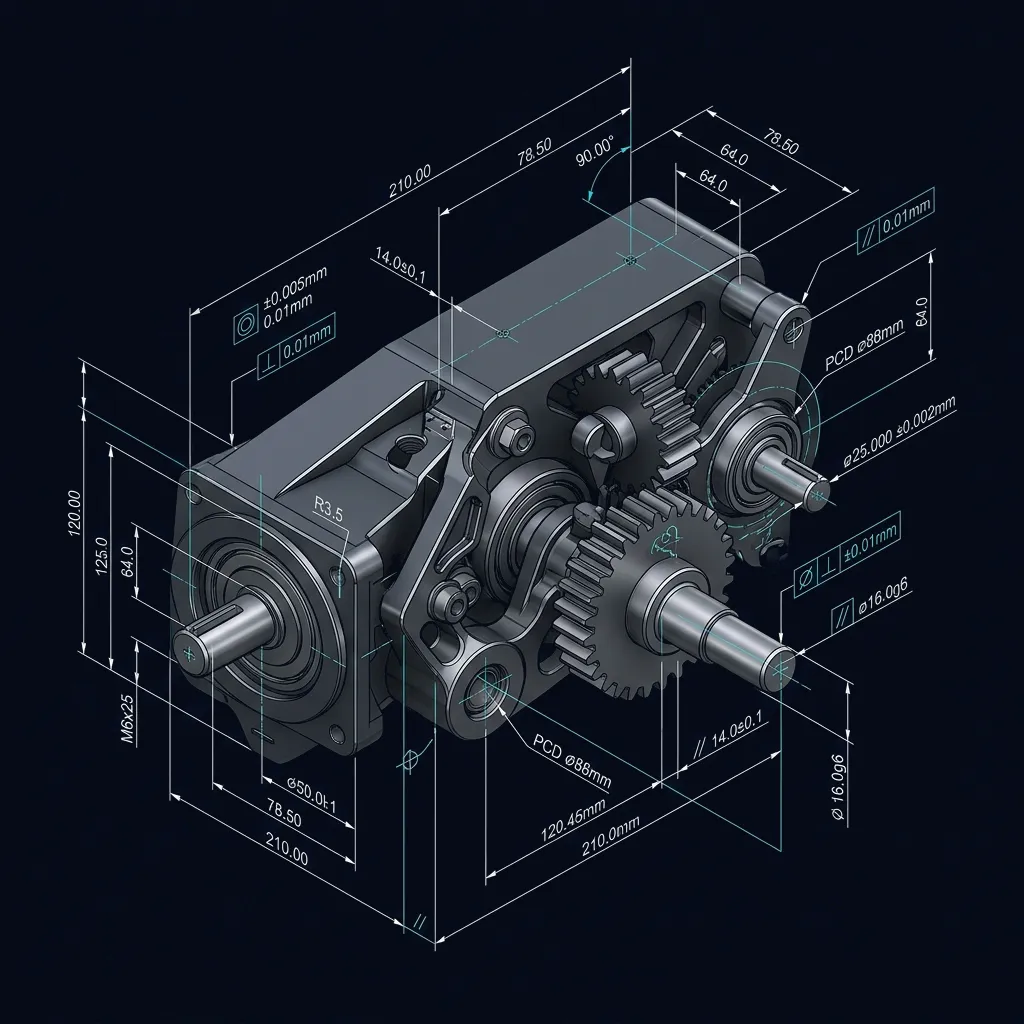
CAD to Part Comparison is a 3D inspection method that overlays a scanned point cloud of a manufactured part directly against its nominal CAD model to detect dimensional deviations, surface warping, GD&T non-conformities, and assembly-fit risks with color-mapped deviation reports.
When to Select This Service
Choose CAD to part comparison when validating first-off production parts against design intent, investigating warping or shrinkage in molded and cast components, or catching assembly-fit issues before they reach the production line.
Technical Capabilities & Verification Standards
Verified engineering parameters, hardware precision, and compliance benchmarks applied across all deliverables.
| Engineering Parameter | APJ 3D Capability & Precision Range | Compliance Standard / Verification |
|---|---|---|
| Colour Deviation Mapping | High-resolution 3D point cloud superimposed over nominal CAD to reveal non-linear warping and surface deviation | Full-Surface Heatmap Analysis |
| Dimensional Deviation Reporting | Exact measurements between critical features versus nominal CAD to detect dimensional deviations before production impact | Feature-to-CAD Comparison |
| GD&T Analysis | Verification of geometric dimensioning and tolerancing non-conformities against the design intent model | GD&T Non-Conformity Detection |
| Inspection Stage Coverage | First Article Inspection (FAI), In-Process QC, and Final QC & Dispatch inspection coverage | Full Production-Cycle Coverage |
| Assembly Risk Detection | Identification of surface warping and assembly risks that visual inspection alone cannot confirm | Data-Verified, Not Visual-Only |
| Report Deliverables | Colour deviation map, dimensional deviation data, and GD&T analysis delivered as a combined inspection report | Combined Deviation Inspection Report |
Frequently Asked Questions
Can you convert legacy 2D paper drawings or PDFs into 3D CAD models?
Can you convert legacy 2D paper drawings or PDFs into 3D CAD models?
Do your 2D engineering drawings include full GD&T callouts?
Do your 2D engineering drawings include full GD&T callouts?
How do you ensure sheet metal flat patterns account for bend allowances?
How do you ensure sheet metal flat patterns account for bend allowances?
Can you provide exploded views and assembly manuals for technical documentation?
Can you provide exploded views and assembly manuals for technical documentation?
What is the process for reviewing and revising drawing packages?
What is the process for reviewing and revising drawing packages?
Every Deviation Has a Cost. Find It Before Your Customer Does.
Get a CAD to part comparison inspection report with colour deviation maps, GD&T analysis, and dimensional deviation reporting.