Ergonomics & Usability Analysis Services
Unlike standard benchmarking that focuses solely on hardware, our Ergonomics Analysis Services evaluate the exact physical interaction between human physiology and product geometry. Through high-precision Product Usability Benchmarking Engineering and pressure mapping, we eliminate operator fatigue and engineer effortless comfort.
Every Comfort Complaint Starts With a Measurable Dimension.
Through rigorous Ergonomic Design Evaluation Services and comprehensive Product Ergonomics Analysis Study, we transform subjective user feedback into precise mechanical parameters.
Grip Diameter
Optimising handle cylindrical volume for sustained torque.
Finger Reach
Mapping index and thumb functional arcs to secondary triggers.
Control Position
Aligning tactile interfaces with natural visual and motor pathways.
Hand Posture
Maintaining neutral wrist angles during high-load operations.
Muscle Fatigue
Minimising localized pressure concentrations over extended shifts.
Cylindrical Grip Volume Optimization
When a tool handle is too narrow or too wide, operator flexor muscles must over-contract to maintain stability. By scanning competitor products and evaluating palm contact area across 5th to 95th percentile hand sizes, we identify the exact 33.5mm – 36.0mm sweet spot for maximum torque transmission with minimal exertion.

The 3D Human Scan Tunnel Workflow
Step inside our virtual investigation studio. Combining ZEISS industrial optical scanning with advanced Product Usability Benchmarking Engineering and Human Factors Benchmarking Consulting.
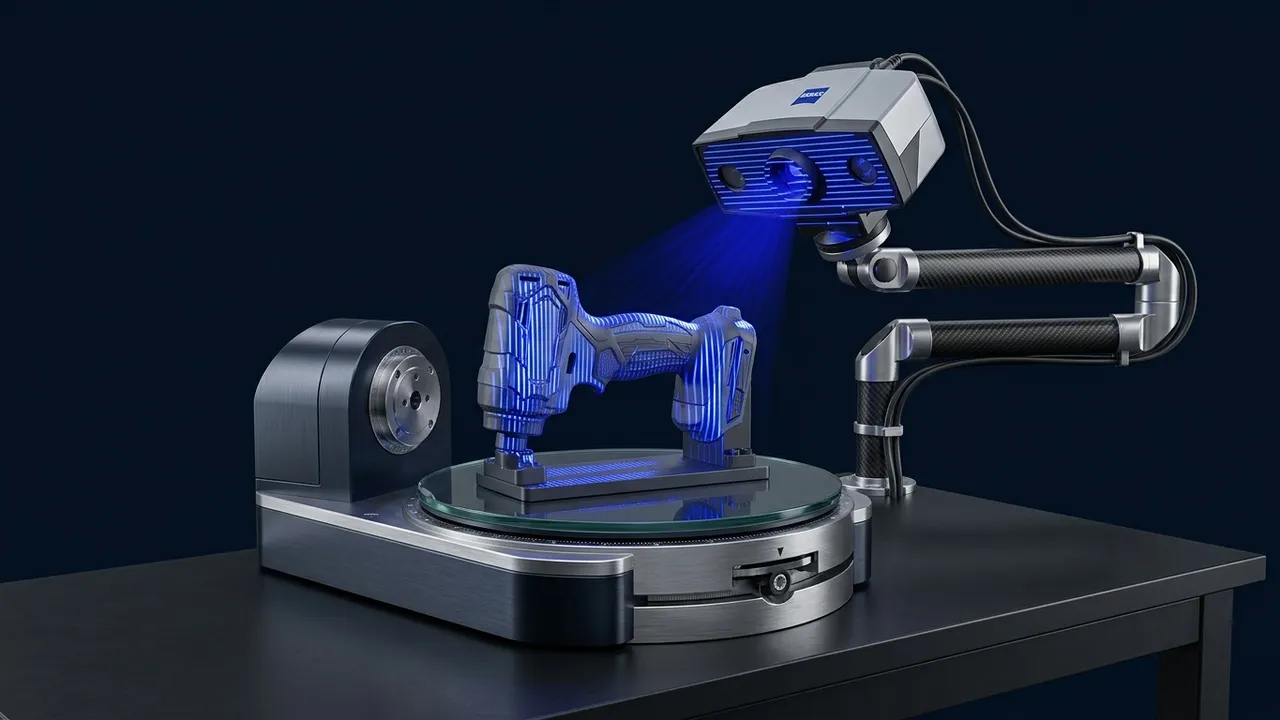
Sub-Millimeter Product Geometric Digitization
We capture the exact physical external geometry of your device and major competitor models using certified ZEISS structured light 3D scanners. This establishes a high-fidelity digital twin with accuracy within ±0.01mm, ready for biomechanical alignment.
Interactive Human Factors Body Mapping Interface
Select an anatomical region to observe how our Ergonomics Analysis Services and Human Factors Benchmarking Consulting evaluate product interaction across physiological zones.

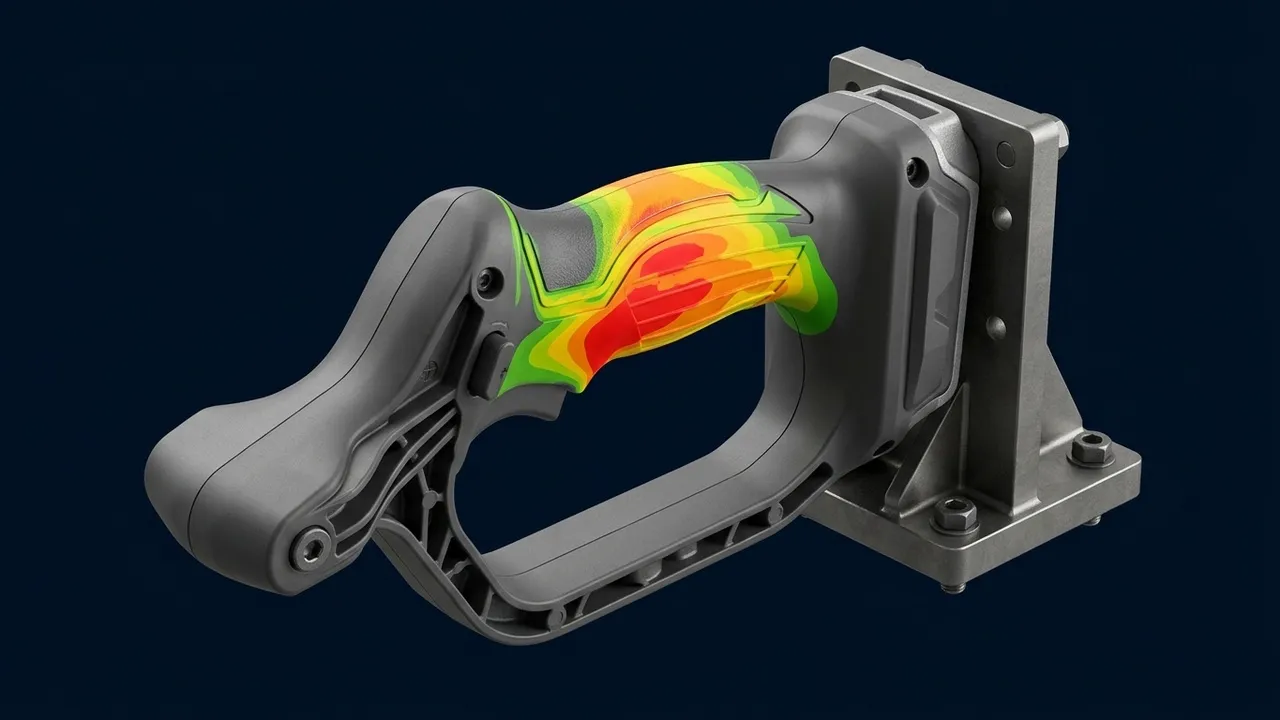
Palmar Pressure Distribution & Vibration Dampening
The human palm houses critical nerve pathways (ulnar and median nerves). Unbuffered pressure peaks from angular product ribs cause numbness and rapid fatigue. We map contact surface area to ensure load is distributed across high-tolerance muscular pads rather than vulnerable nerve canals.
Competitor Usability Benchmark Studio
Compare your design against market leaders across vital human factors metrics using our empirical Product Usability Benchmarking Engineering database.
7.2 / 10
Overall Grip Comfort RatingMarket leader utilizes a dual-durometer elastomeric overmold that increases effective palm contact area by 22%, distributing actuation loads evenly.
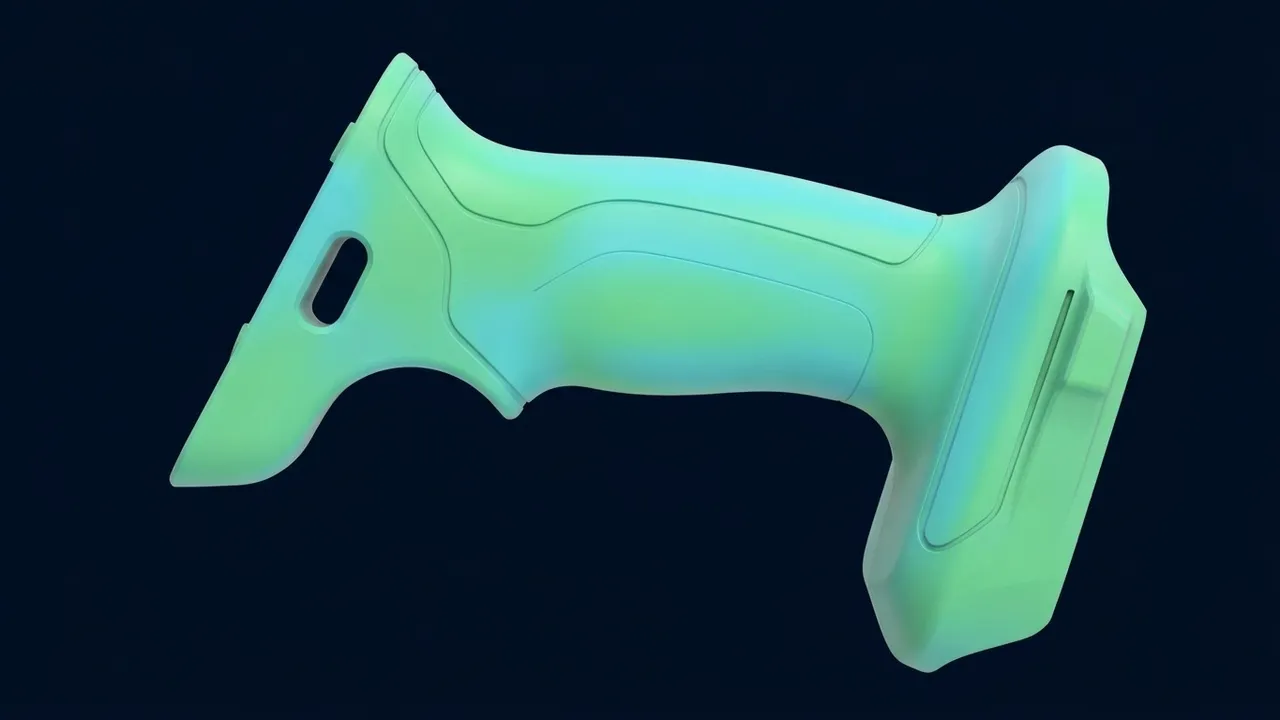
8.5 / 10
Overall Grip Comfort RatingDesign Optimisation Engineering Canvas
Explore our digital workspace where Ergonomic Design Evaluation Services directly dictate geometric CAD refinements before tooling committal.
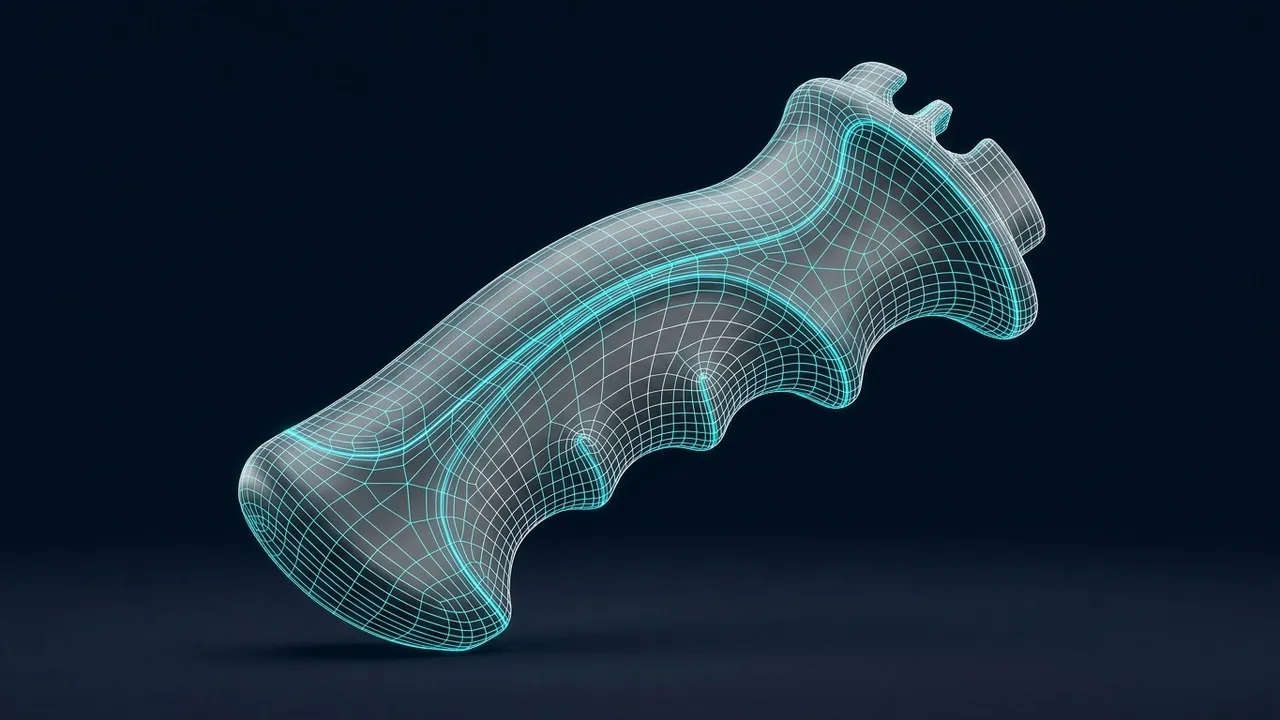
Compound Palmar Arch Profile Adjustment
Original straight cylindrical draft caused excessive localized friction on index and pinky metacarpals. We engineered an elliptical compound curve tapering from 36mm at the apex to 32mm at the base, conforming perfectly to resting hand geometry.
Deliverables & Human Factors Reports
Comprehensive documentation backed by our empirical Product Ergonomics Analysis Study methodology, delivered across India from our tech centers in Chennai, Coimbatore, Pune, and Bangalore.
High-Resolution 3D Surface & Contour Inspection Report
Detailed color-coded deviation maps comparing physical prototypes against theoretical CAD geometry. Highlights exact areas of shrinkage, warpage, or unintended ergonomic profile distortion during initial injection molding trials.

What is Ergonomics & Usability Analysis Services?
Ergonomics and Usability Analysis evaluates the physical interaction between human physiology and product geometry using techniques such as pressure mapping and posture assessment, going beyond hardware-only benchmarking to engineer effortless comfort into a product.
When to Select This Service
Choose ergonomics and usability analysis when operator fatigue, grip discomfort, or awkward reach and posture are affecting product usability, and you need pressure-mapped, physiology-driven data to guide redesign.
Technical Capabilities & Verification Standards
Verified engineering parameters, hardware precision, and compliance benchmarks applied across all deliverables.
| Engineering Parameter | APJ 3D Capability & Precision Range | Compliance Standard / Verification |
|---|---|---|
| Anthropometric Hand & Body Mapping | Virtual 3D hand models spanning 5th percentile female to 95th percentile male superimposed onto the scanned product geometry | Digital Hand Rigging |
| Palmar Pressure Distribution | Contact pressure across the palm mapped to keep peak pressure below 25 kPa, routing load onto muscular pads rather than nerve canals | Peak Pressure < 25 kPa |
| Wrist Joint Alignment | Handle tilt benchmarked against natural working postures to keep radial and ulnar deviation under 10° from neutral | Deviation < 10° from Neutral |
| Reach Envelope Validation | Thumb and index finger sweep arcs digitized across user demographics so switches and controls fall within effortless reach zones | 100% Reach Accessibility |
| Sustained-Use Fatigue Mitigation | Localized pressure mapping combined with biomechanical calculation over an 8-hour shift to eliminate pressure hot-spots | +45% Extended Shift Endurance |
| Regional Anthropometric Coverage | Product benchmarked against Indian, European, and North American ergonomic databases for universal market acceptance | Multi-Region Database |
| Usability Scorecard | Executive ranking matrix scoring the product against competitors across 10 empirical usability criteria including grip comfort and fatigue index | Market Comparison Scorecard |
Frequently Asked Questions
Can you perform 3D scanning on-site at our manufacturing plant?
Can you perform 3D scanning on-site at our manufacturing plant?
How do 3D scanning and reverse engineering differ?
How do 3D scanning and reverse engineering differ?
What is a color deviation inspection map?
What is a color deviation inspection map?
Can dark, shiny, or transparent surfaces be scanned?
Can dark, shiny, or transparent surfaces be scanned?
What accuracy can we expect for automotive and aerospace components?
What accuracy can we expect for automotive and aerospace components?
Build Products That Feel Right Before They Reach Your Users.
Whether you are designing a high-precision surgical handle, an automotive interior interface, or heavy industrial machinery, our Ergonomics Analysis Services ensure your product dominates the market in tactile comfort and usability.