Performance Analysis & Competitive Functional Study
Decode exact competitive mechanics with high-precision functional benchmarking and CAE-ready performance analysis. We capture sub-micron structural geometry, FEA stress distributions, and fluid dynamics to empower product engineering teams.
Your Competitor's Product Performs Better. The Geometry Is Where the Answer Sits.
Surface inspections reveal nothing. True performance advantages are embedded deep inside micro-geometry, draft angles, internal rib configurations, and wall thickness distributions. Hover over the investigation vectors below.
Observable competitive advantage in peak mechanical rigidity
Sub-micron structural variations captured via 3D blue light scan
Internal material distribution & volumetric cavity analysis
Heat dissipation geometry & assembly tolerance stack analysis
Optimised internal cross-section profiles resist torsional flex under peak mechanical loads.
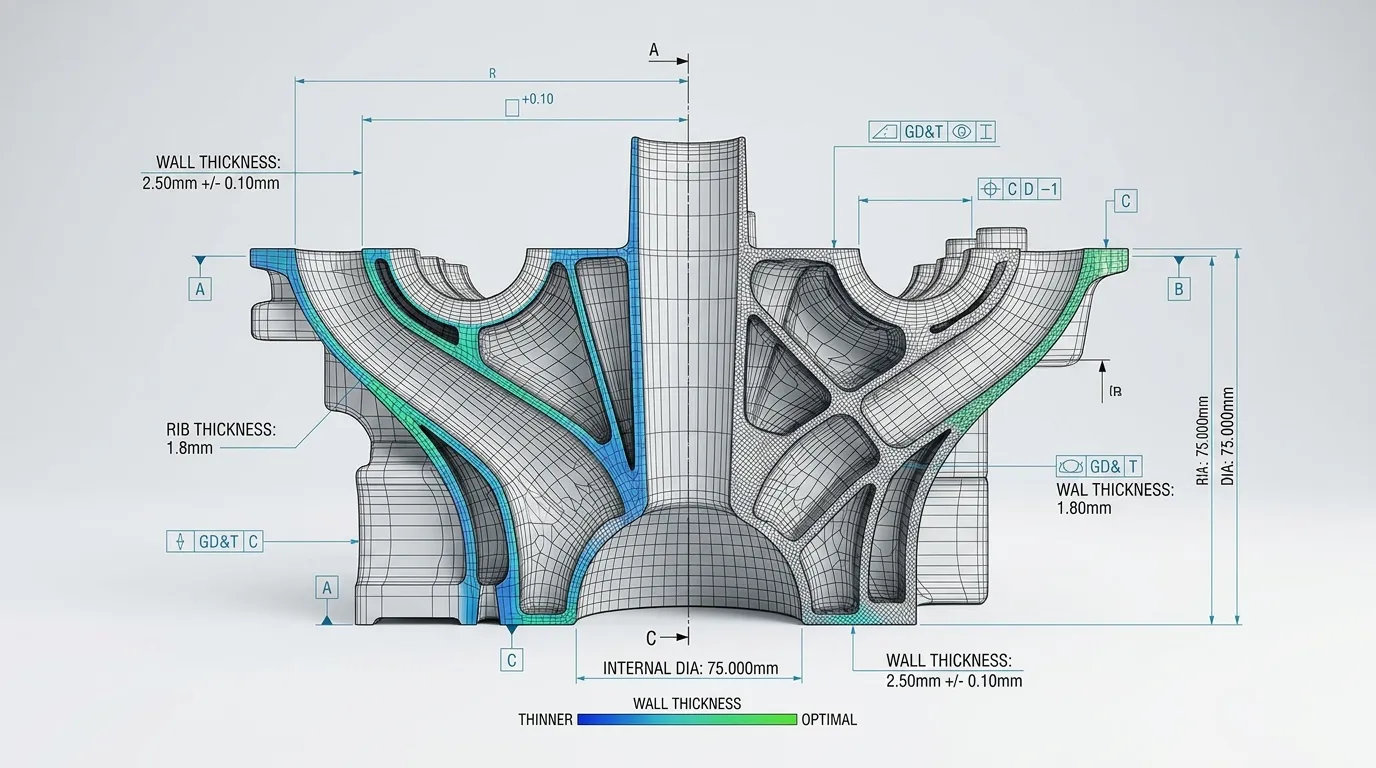
What Functional Benchmarking Covers
Complete 360-degree digital performance characterization structured into standardized CAE verification models.
High-Accuracy Geometry Capture
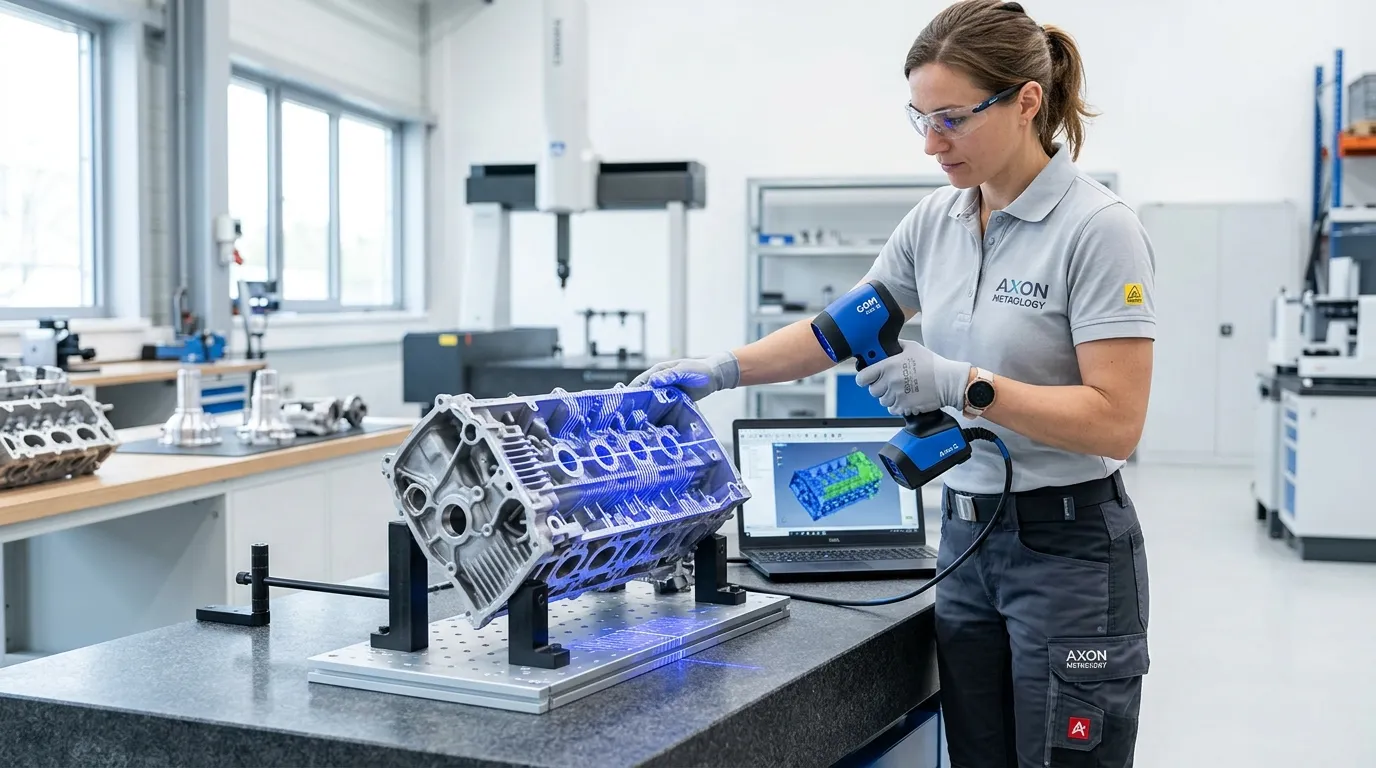
Sub-micron optical and laser scanning generating dense point clouds of external aerodynamic and structural surfaces.
Wall Thickness Analysis
Non-destructive X-ray CT scanning mapping internal core shifts, porosity anomalies, and precise wall thickness heat maps.
Cross-Section Profiling
Systematic slicing through critical load paths to evaluate section modulus, neutral axis placement, and bending resistance.
Assembly Interface Mapping
Measuring bolt hole alignments, gasket compression boundaries, snap-fit interference, and fastener seating geometry.
Tolerance Mapping & GD&T
Comparative GD&T evaluation comparing production physical variance against intended engineering nominal drawings.
Performance Telemetry Synthesis
Correlating physical geometry measurements directly to acoustic, dynamic, and flow performance test bench results.
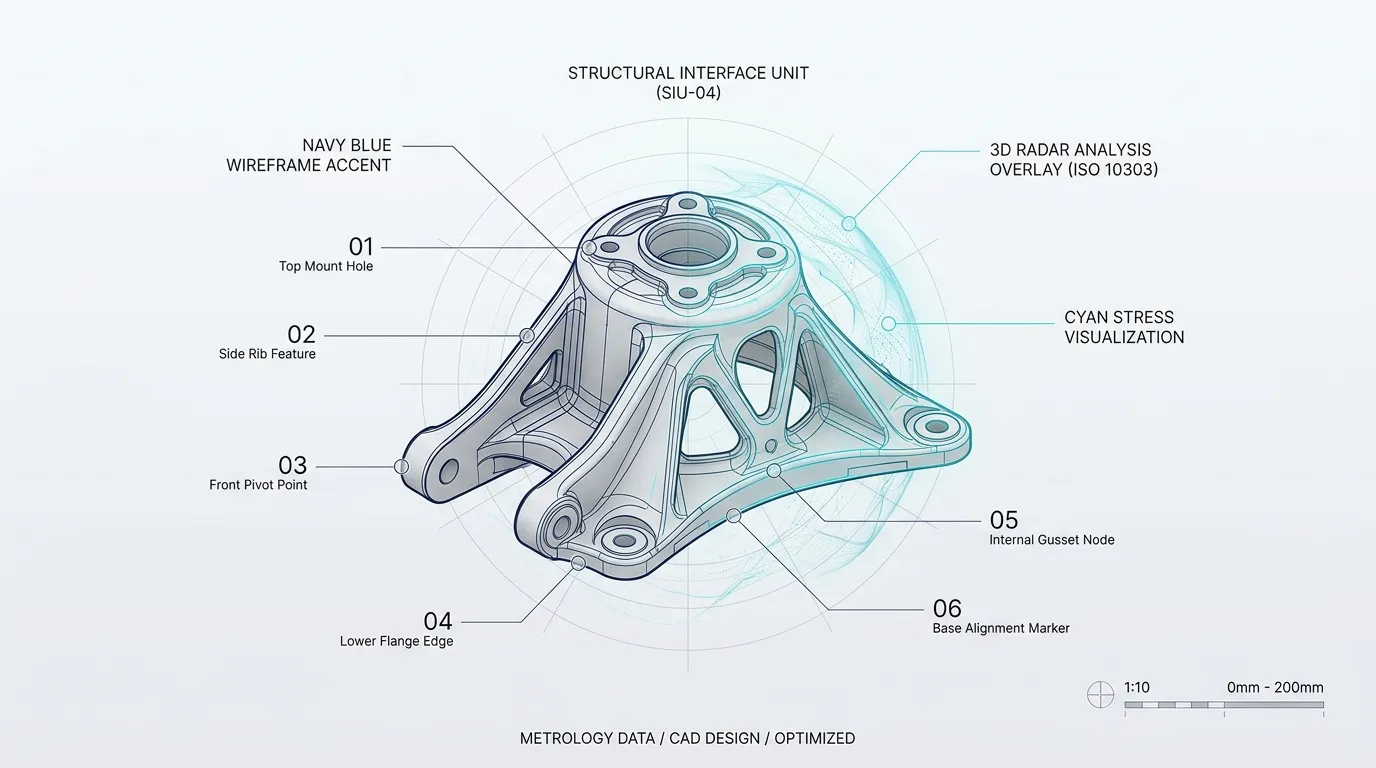
Geometry to Performance Mapping
Interactive real-time correlation linking physical geometric structures directly to simulated engineering outcomes.
Direct mass reduction saving tooling and raw material BOM costs across production runs.
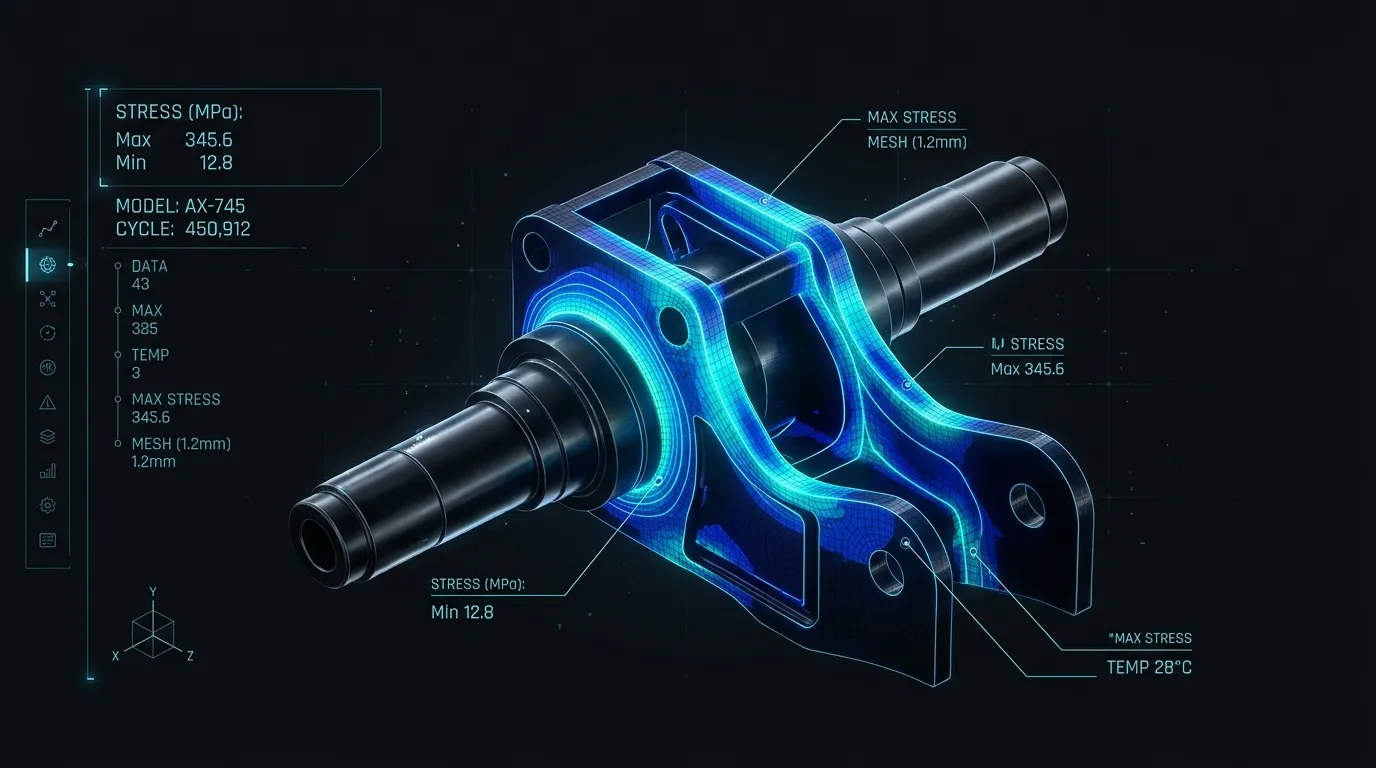
Recent Performance Benchmarking Project
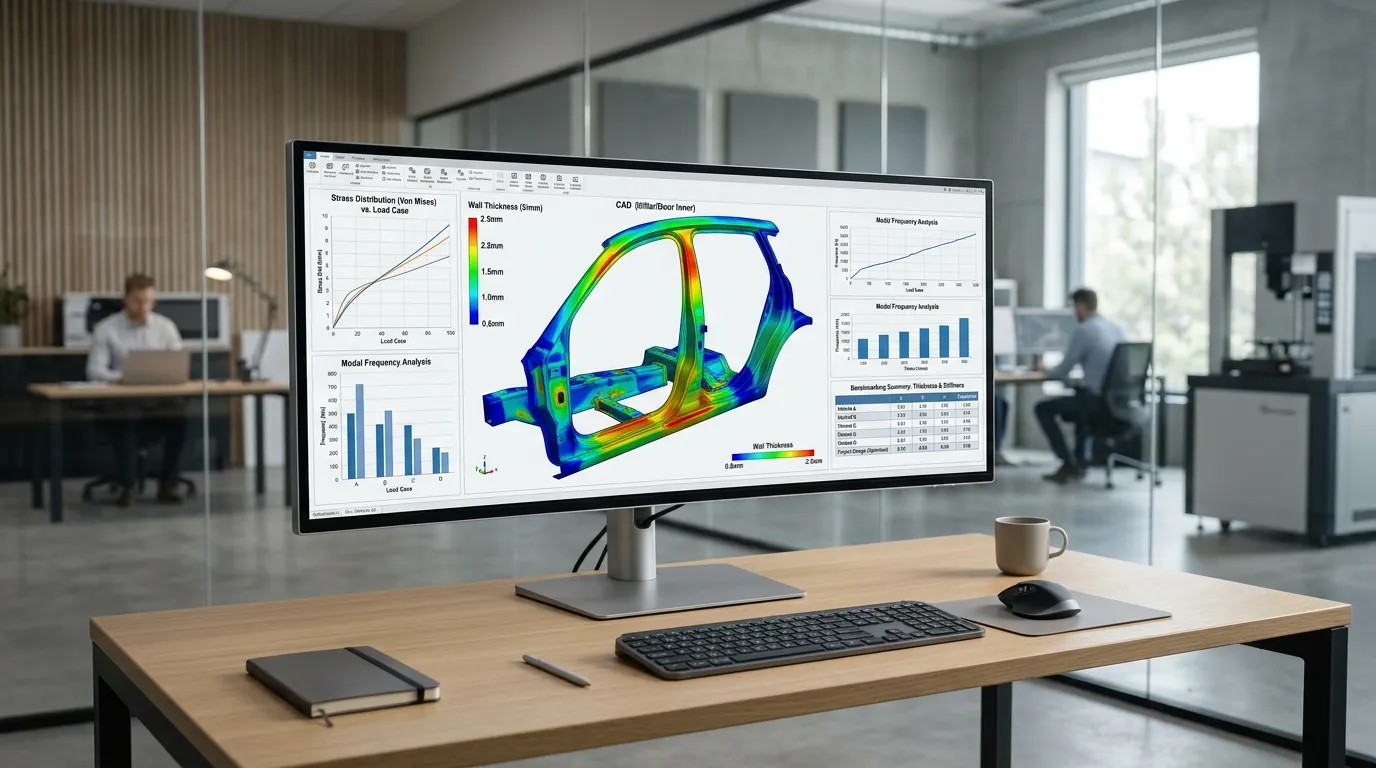
How APJ 3D Delivers Functional Product Comparison
Rapid cleanroom lab processing coupled with portable on-site OEM facility scanning.
Logging baseline customer benchmark hardware.
Capturing 3D exterior mesh point clouds.
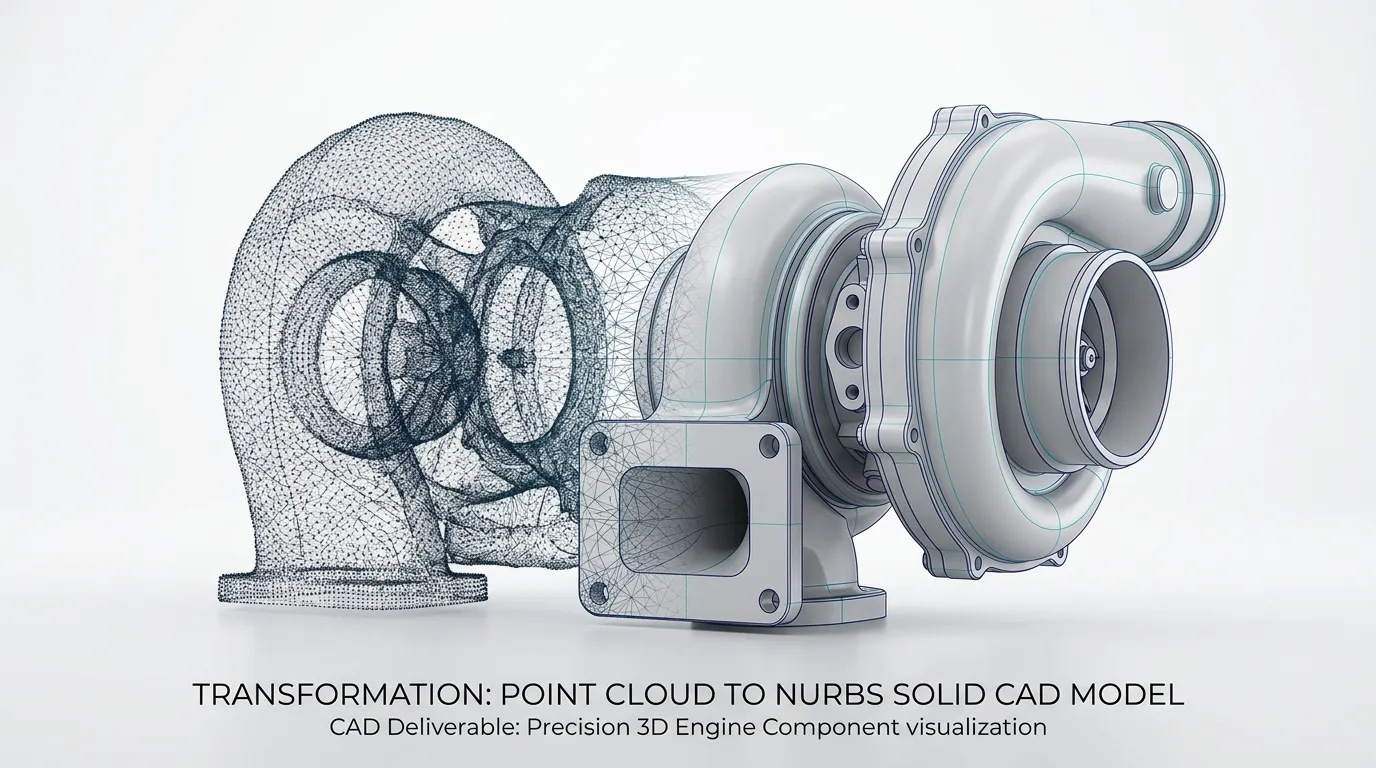
Surfacing NURBS CAD models ready for FEA.
Correlating test bench data to wall thickness.
Delivering executive redesign engineering package.
Deliverables for Engineering & CAE Teams
Exhaustive simulation datasets formatted directly for ANSYS, Abaqus, Nastran, and hyper-mesh environments.
High-density sub-micron optical scan data generating clean point clouds of external aerodynamic and structural surfaces ready for mesh wrapping.
What is Functional & Performance Benchmarking Services India?
Competitive Benchmarking and Should-Costing is the structured physical disassembly, material identification, process cycle-time estimation, and bottom-up cost modeling of competitor products and vehicle subsystems.
When to Select This Service
Choose teardown and should-costing when seeking actionable VAVE cost-reduction roadmaps (typically 10%–25% savings), supplier quotation validations, or competitive product intelligence.
Technical Capabilities & Verification Standards
Verified engineering parameters, hardware precision, and compliance benchmarks applied across all deliverables.
| Engineering Parameter | APJ 3D Capability & Precision Range | Compliance Standard / Verification |
|---|---|---|
| Benchmarking Scope | Full Vehicle Teardown (EV/ICE), Subsystems, Powertrains, Battery Packs, Industrial Equipment, Home Appliances | Standardized AIAG / VAVE Protocols |
| Costing Methodology | Bottom-Up Should-Costing (Raw material + Cycle time + Machine rates + Tooling amortization + SG&A/Profit) | Global & Indian Cost Databases |
| Material Characterization | Spectroscopy (OES/XRF), Polymer FTIR, Hardness Testing, Tensile & Microstructure Evaluation | NABL Accredited Lab Verification |
| Deliverables | Teardown Photo Books, Digital Bill of Materials (BOM), Should-Cost Models (Excel), VAVE Idea Roadmaps, CAD Assemblies | Complete Digital Teardown Portals |
| Typical Cost Savings | 10% to 25% achievable component cost reduction through DFM/VAVE recommendations | High-ROI Engineering Insights |
| Facility Capability | Dedicated 15,000+ sq.ft. Secure Vehicle & Subsystem Teardown Bays in Hosur & Chennai | NDAs & High-Security Protocols |
| Turnaround Time | 1 to 3 weeks for subsystem teardown and comprehensive should-cost models | Turnkey Benchmarking Programs |