Heavy Commercial Vehicle Benchmarking Services in India
HCV Truck Benchmarking Engineering & Digital Twin creation to uncover actionable competitive intelligence, chassis scanning, and frame geometry isolation for large-scale logistics platforms across India.
The Engineering Advantage
Hover over the traditional pain points below to reveal the modern APJ 3D solution.
Manual measurements creating stack-up tolerance errors.
Laser Tracker Metrology: Sub-millimeter chassis scanning.
Loss of 3D spatial relationships after disassembly.
Digital Twin: 3D Scan data to native parametric CAD.
Siloed data restricted to specific engineering departments.
Cross-Functional Platform: One source of truth for Engineering & Strategy.
Static reports that become obsolete instantly.
Metallurgical Deep Dive: Spectrometry of critical joints mapped to 3D models.
Comprehensive Benchmarking Coverage
From the driver's seat to the driveline, our intelligence spans the entire vehicle.
Powertrain Packaging
Driveline efficiency, cooling layouts, and aftertreatment routing.
Explore Driveline →Chassis Frame
Bending stiffness, crossmember geometry, and payload distribution load paths.
Explore Chassis →Metallurgy
Spectrometry and failure analysis of heavy-duty components.
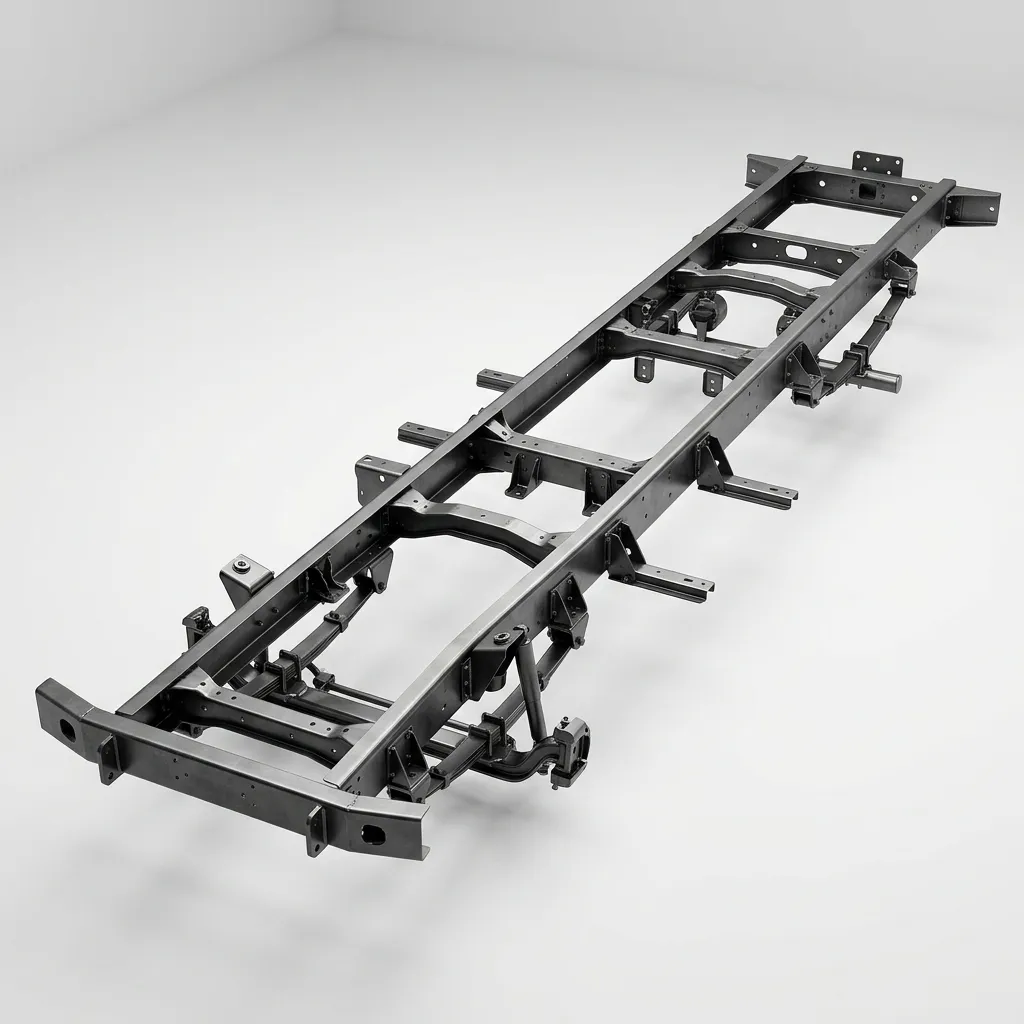
Structural Benchmarking Lab
Scroll to dissect the commercial chassis layer by layer.
Frame Geometry Mapping
Detailed section profiles and longitudinal bending stiffness analysis to ensure maximal load limits.
Crossmember Benchmarking
Thickness analysis and torsion resistance mapping for heavy, uneven loads over rough terrain.
Mounting Architecture
Suspension and engine mounting points isolation intelligence, reducing cabin vibrations.
Weight Reduction
Identifying structural over-engineering for payload optimization without sacrificing safety.
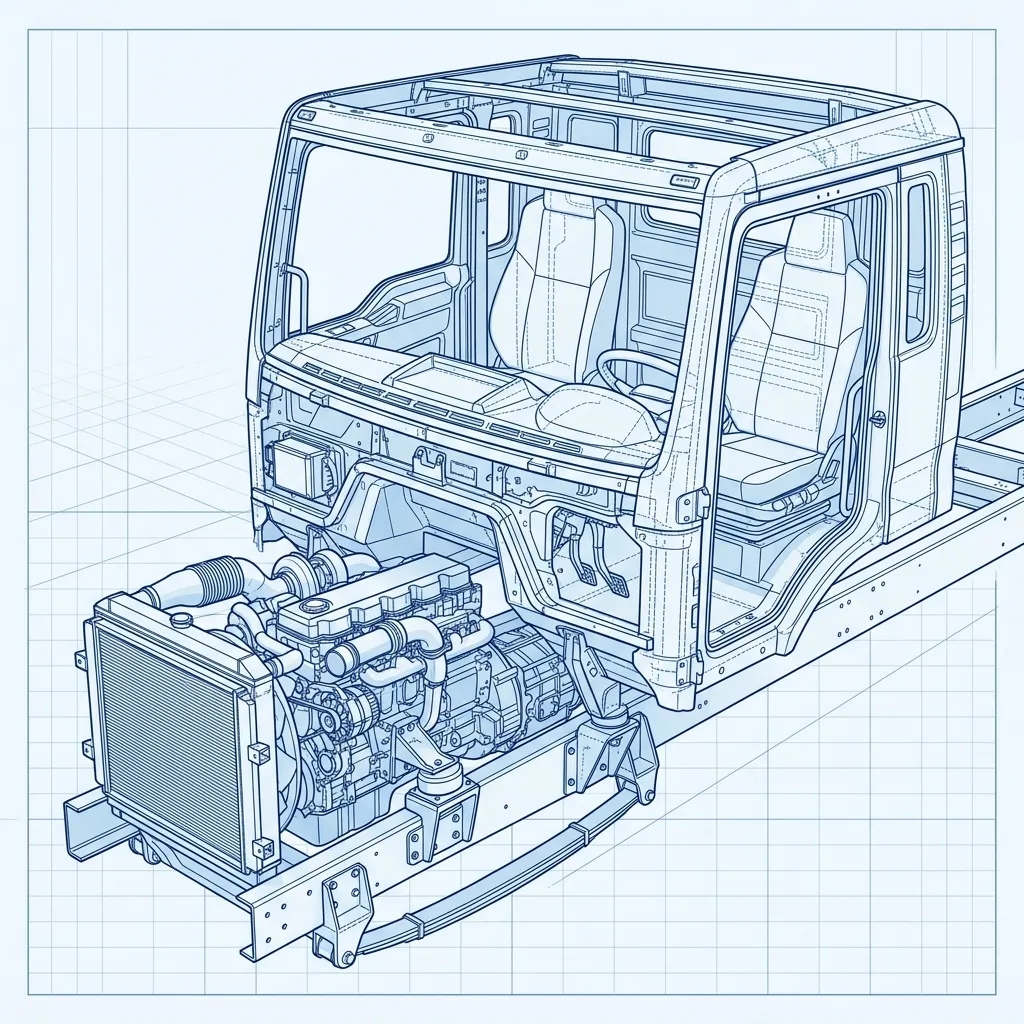
Cab & Powertrain Deep Dive
Extracting structural intelligence through precision metrology.
Roof Bows Analysis
Evaluating structural integrity and rollover safety metrics.
Pillars & Impact Strength
Testing material composition for crash energy absorption.
Firewall Integration
NVH isolation and thermal barrier efficiency.
Cooling Layout Efficiency
Airflow simulation mapping for severe load conditions.
Driveline Geometry
U-joint angle optimization and parasitic loss reduction.
The Intelligence Pipeline
A rigorous, stage-gated process transforming raw scan data into actionable engineering decisions.
3D Scan Capture
High-resolution point clouds acquired using metrology-grade laser trackers.
Point Cloud Assembly
Aligning billions of data points into a cohesive, sub-millimeter accurate digital twin.
Geometry Extraction
Converting scanned meshes into pure, editable parametric CAD surfaces.
Design Decisions
Evaluating structural load paths and identifying competitive engineering advantages.

What is Heavy Commercial Vehicle Benchmarking?
Competitive Benchmarking and Should-Costing is the structured physical disassembly, material identification, process cycle-time estimation, and bottom-up cost modeling of competitor products and vehicle subsystems.
When to Select This Service
Choose teardown and should-costing when seeking actionable VAVE cost-reduction roadmaps (typically 10%–25% savings), supplier quotation validations, or competitive product intelligence.
Technical Capabilities & Verification Standards
Verified engineering parameters, hardware precision, and compliance benchmarks applied across all deliverables.
| Engineering Parameter | APJ 3D Capability & Precision Range | Compliance Standard / Verification |
|---|---|---|
| Benchmarking Scope | Full Vehicle Teardown (EV/ICE), Subsystems, Powertrains, Battery Packs, Industrial Equipment, Home Appliances | Standardized AIAG / VAVE Protocols |
| Costing Methodology | Bottom-Up Should-Costing (Raw material + Cycle time + Machine rates + Tooling amortization + SG&A/Profit) | Global & Indian Cost Databases |
| Material Characterization | Spectroscopy (OES/XRF), Polymer FTIR, Hardness Testing, Tensile & Microstructure Evaluation | NABL Accredited Lab Verification |
| Deliverables | Teardown Photo Books, Digital Bill of Materials (BOM), Should-Cost Models (Excel), VAVE Idea Roadmaps, CAD Assemblies | Complete Digital Teardown Portals |
| Typical Cost Savings | 10% to 25% achievable component cost reduction through DFM/VAVE recommendations | High-ROI Engineering Insights |
| Facility Capability | Dedicated 15,000+ sq.ft. Secure Vehicle & Subsystem Teardown Bays in Hosur & Chennai | NDAs & High-Security Protocols |
| Turnaround Time | 1 to 3 weeks for subsystem teardown and comprehensive should-cost models | Turnkey Benchmarking Programs |
Frequently Asked Questions
What is included in a product teardown report?
What is included in a product teardown report?
How does should-costing help in supplier negotiations?
How does should-costing help in supplier negotiations?
What is VAVE and how do you generate savings ideas?
What is VAVE and how do you generate savings ideas?
Can you benchmark electric vehicle (EV) battery packs and powertrains?
Can you benchmark electric vehicle (EV) battery packs and powertrains?
How do you maintain confidentiality and intellectual property during teardowns?
How do you maintain confidentiality and intellectual property during teardowns?
Need Competitive Benchmarking for Your Vehicles?
From Complete Vehicle Teardowns to Subsystem Cost Analysis — APJ 3D Delivers Actionable Engineering Intelligence Across India.