Product Cost Benchmarking Services India
Understand Where Your Product Costs More.
APJ 3D provides expert product cost benchmarking services and competitor product cost analysis. We leverage product teardown cost benchmarking and BOM cost optimisation engineering to reveal precise cost gaps.
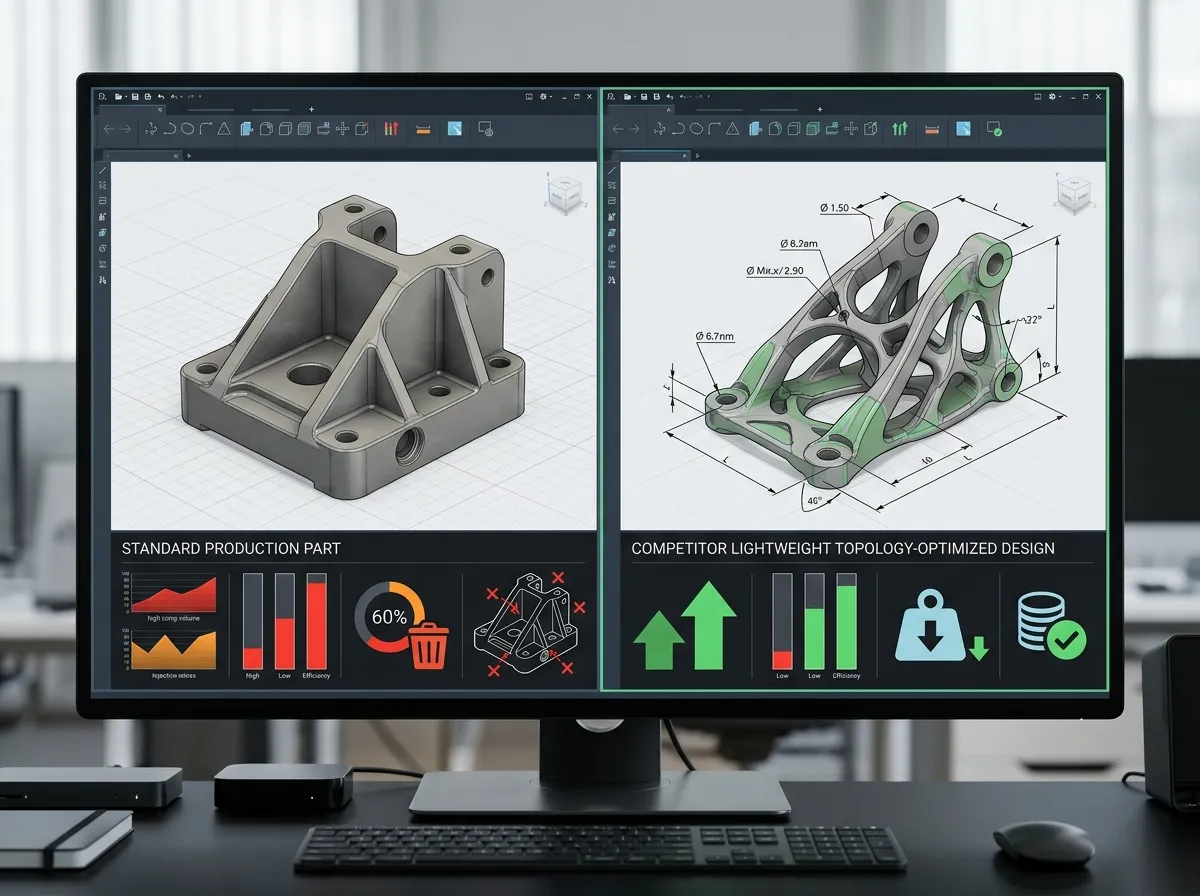
Where Does the Cost Gap Exist?
Our product cost benchmarking services and competitor product cost analysis identify exact discrepancies.
Your Product
Engineering Comparison
Competitor Product
Cost Difference
Improvement Opportunity
Benchmarking Solutions
Comprehensive teardown, BOM optimisation, and competitor intelligence engineering to eliminate margin leakage.
Competitor Cost Analysis
Engineering comparison, material validation, and teardown cost breakdowns across competitor portfolios.
Product Teardown Benchmarking
Exploded assembly analysis, fastener count minimization, and sub-tier supplier cost estimation.
BOM Cost Optimisation
Material substitution, process routing adjustments, and assembly labor reduction across high-volume assemblies.
Cost Reduction Consulting
End-to-end industrial cost reduction consulting from benchmark audit to shop-floor implementation.
Engineering Validation
3D CAD metrology, simulation checks, and DFM reviews ensuring cost-down proposals preserve product integrity.
Supplier Benchmarking
Verifiable cost modeling to challenge supplier quotes and drive fact-based procurement negotiations.

Benchmarking Workflow
A systematic competitor product cost analysis approach.
We identify and secure the target competitor products, establishing a precise baseline for the product cost benchmarking engagement.
Systematic dismantling of the product. Every component, fastener, and sub-assembly is isolated, cataloged, and weighed to prepare for deep engineering cost analysis.
Spectroscopic and metallurgical analysis to precisely identify plastics, alloys, and composites used by the competitor, determining exact raw material costs.
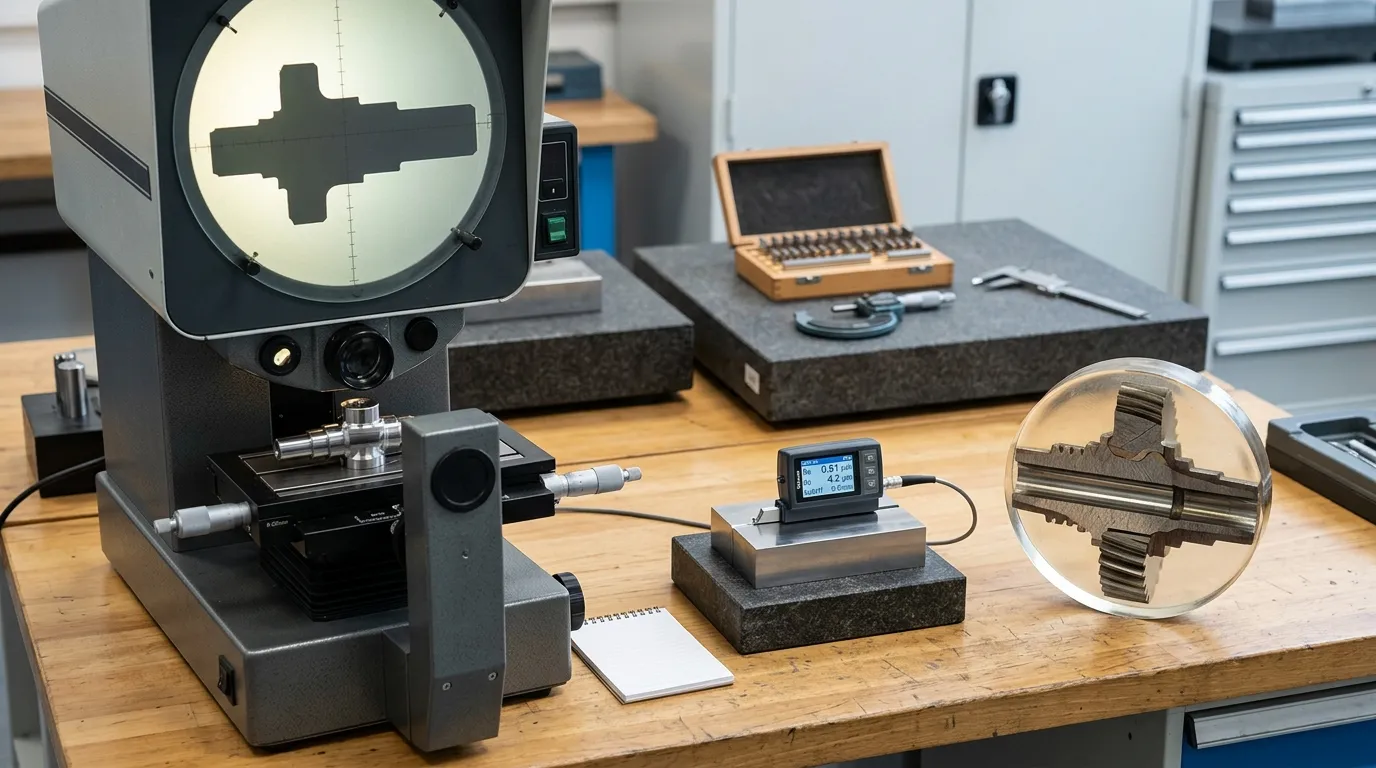
High-resolution metrology and 3D scanning of complex parts to capture precise volumetric data, wall thicknesses, and geometry for tooling cost estimation.
Applying our proprietary manufacturing cost models. We simulate the manufacturing processes (casting, molding, stamping) to generate an accurate should-cost baseline.
Comparing your current BOM costs against the competitor's simulated should-cost. We highlight specific discrepancies in material, weight, or process efficiency.
Delivering actionable BOM cost optimisation engineering outputs. We provide concrete design-for-manufacturing (DFM) alternatives to bridge the cost gap.
Engineering Cost Benchmark Dashboard

Industries & Applications
Automotive Benchmarking
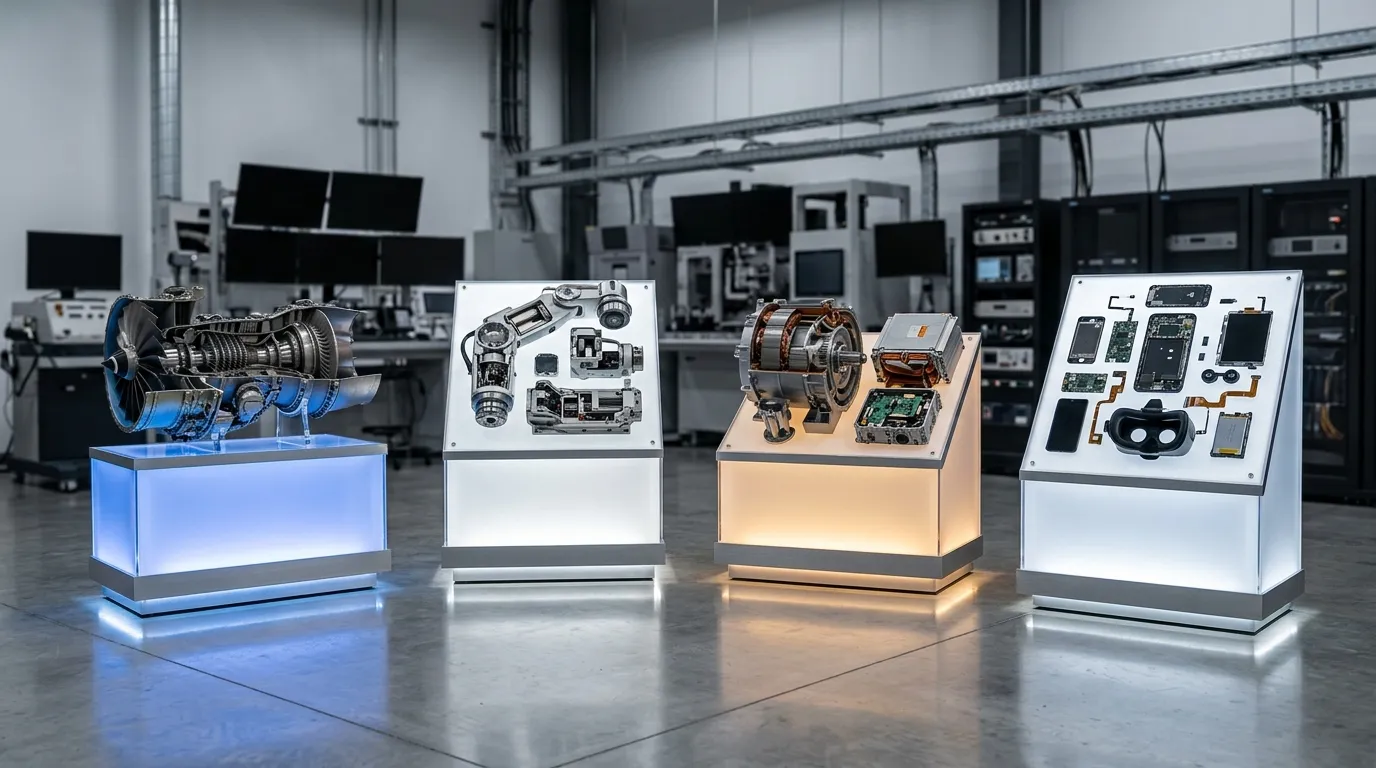
Typical benchmarking applications for the automotive sector including cost optimisation opportunities and precise engineering outputs.
Related Services:
- → Manufacturing Should-Cost Analysis
- → Vendor Cost Validation
- → Cost Driven Design Optimisation
- → Overdesign Identification
Why APJ Benchmarking Is Different
Traditional Benchmarking
- ✗ Market Pricing
- ✗ Supplier Quotes
- ✗ Historical Estimates
- ✗ Generic Databases
- ✗ Limited Engineering Validation
APJ Engineering Benchmarking
- ✓ Physical Teardown
- ✓ Confirmed Geometry
- ✓ Material Verification
- ✓ Engineering Cost Models
- ✓ Component-Level Benchmarking
What is Product Cost Benchmarking Services India?
Competitive Benchmarking and Should-Costing is the structured physical disassembly, material identification, process cycle-time estimation, and bottom-up cost modeling of competitor products and vehicle subsystems.
When to Select This Service
Choose teardown and should-costing when seeking actionable VAVE cost-reduction roadmaps (typically 10%–25% savings), supplier quotation validations, or competitive product intelligence.
Technical Capabilities & Verification Standards
Verified engineering parameters, hardware precision, and compliance benchmarks applied across all deliverables.
| Engineering Parameter | APJ 3D Capability & Precision Range | Compliance Standard / Verification |
|---|---|---|
| Benchmarking Scope | Full Vehicle Teardown (EV/ICE), Subsystems, Powertrains, Battery Packs, Industrial Equipment, Home Appliances | Standardized AIAG / VAVE Protocols |
| Costing Methodology | Bottom-Up Should-Costing (Raw material + Cycle time + Machine rates + Tooling amortization + SG&A/Profit) | Global & Indian Cost Databases |
| Material Characterization | Spectroscopy (OES/XRF), Polymer FTIR, Hardness Testing, Tensile & Microstructure Evaluation | NABL Accredited Lab Verification |
| Deliverables | Teardown Photo Books, Digital Bill of Materials (BOM), Should-Cost Models (Excel), VAVE Idea Roadmaps, CAD Assemblies | Complete Digital Teardown Portals |
| Typical Cost Savings | 10% to 25% achievable component cost reduction through DFM/VAVE recommendations | High-ROI Engineering Insights |
| Facility Capability | Dedicated 15,000+ sq.ft. Secure Vehicle & Subsystem Teardown Bays in Hosur & Chennai | NDAs & High-Security Protocols |
| Turnaround Time | 1 to 3 weeks for subsystem teardown and comprehensive should-cost models | Turnkey Benchmarking Programs |
Frequently Asked Questions
What is included in a product teardown report?
What is included in a product teardown report?
How does should-costing help in supplier negotiations?
How does should-costing help in supplier negotiations?
What is VAVE and how do you generate savings ideas?
What is VAVE and how do you generate savings ideas?
Can you benchmark electric vehicle (EV) battery packs and powertrains?
Can you benchmark electric vehicle (EV) battery packs and powertrains?
How do you maintain confidentiality and intellectual property during teardowns?
How do you maintain confidentiality and intellectual property during teardowns?
Benchmark Your Product Against the Best—Not the Average
Whether you need product cost benchmarking services, competitor product cost analysis, product teardown cost benchmarking, or BOM cost optimisation engineering, APJ 3D provides engineering-backed benchmarking that helps procurement and engineering teams identify measurable cost reduction opportunities with confidence.