Why Should-Cost Matters
Eliminating procurement blind spots by replacing subjective supplier price negotiations with deterministic engineering cost models.
- • Accepting unverified vendor price inflations
- • Paying hidden overhead & scrap markups
- • Zero engineering leverage against tooling bills
- • Granular raw material & true scrap modeling
- • Exact simulation of machine cycle times
- • Pinpoint line-item data to secure fair quotes
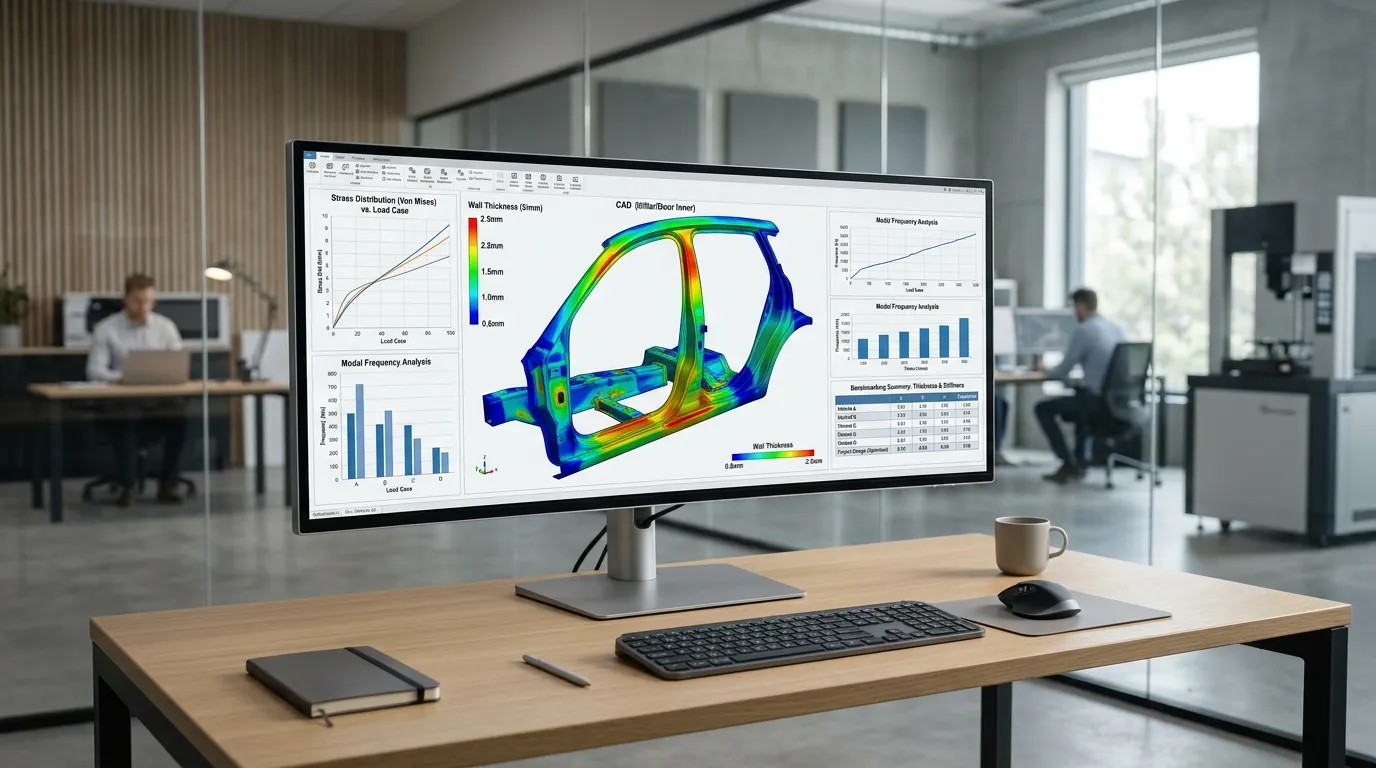
What We Analyse
Deconstructing every physical product into its core economic drivers across geometry, tooling, and shop-floor overheads.
Geometry & Material Utilization
We extract 3D CAD volumetric data to calculate net physical weight, gross raw material blank sizes, off-cut scrap percentages, and commodity market rates.
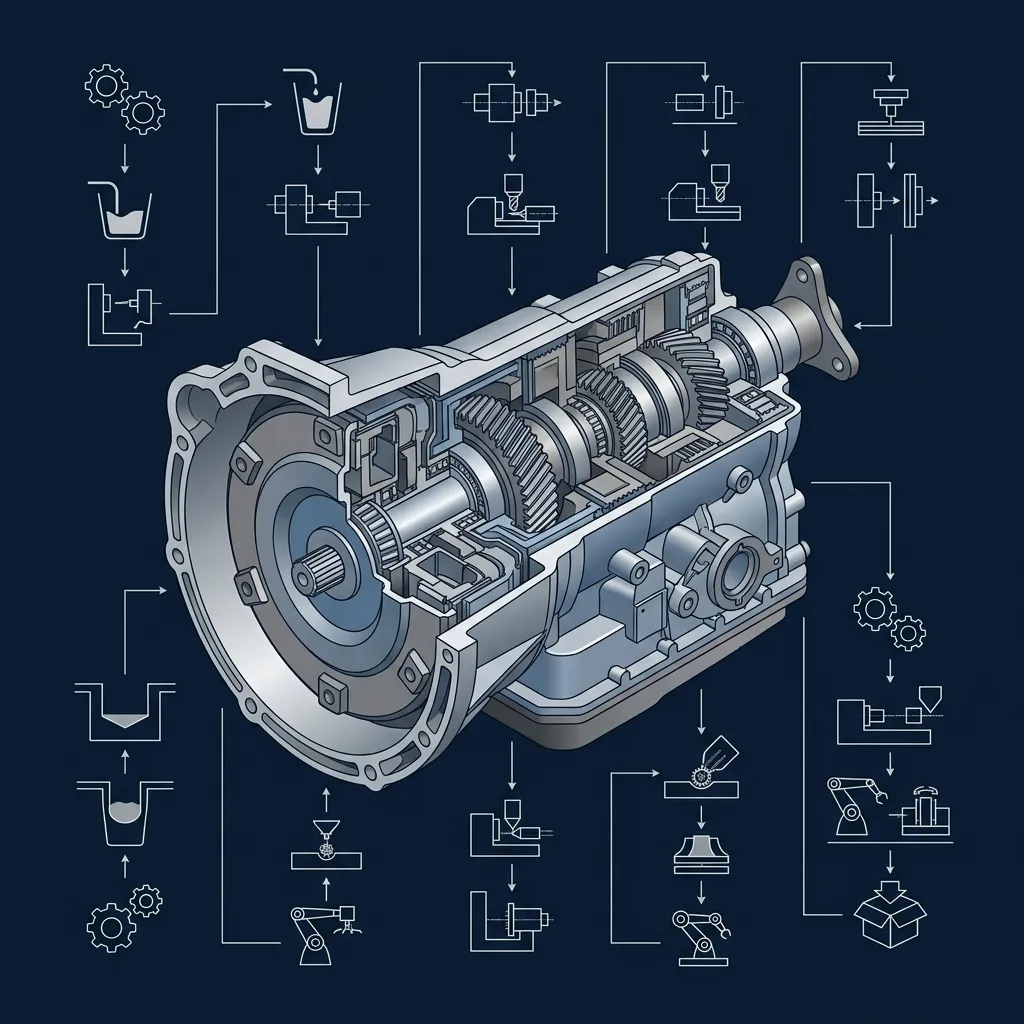
How the Cost Model is Built
A systematic 7-stage engineering methodology linking physical scan geometry directly to verified line-item economics.
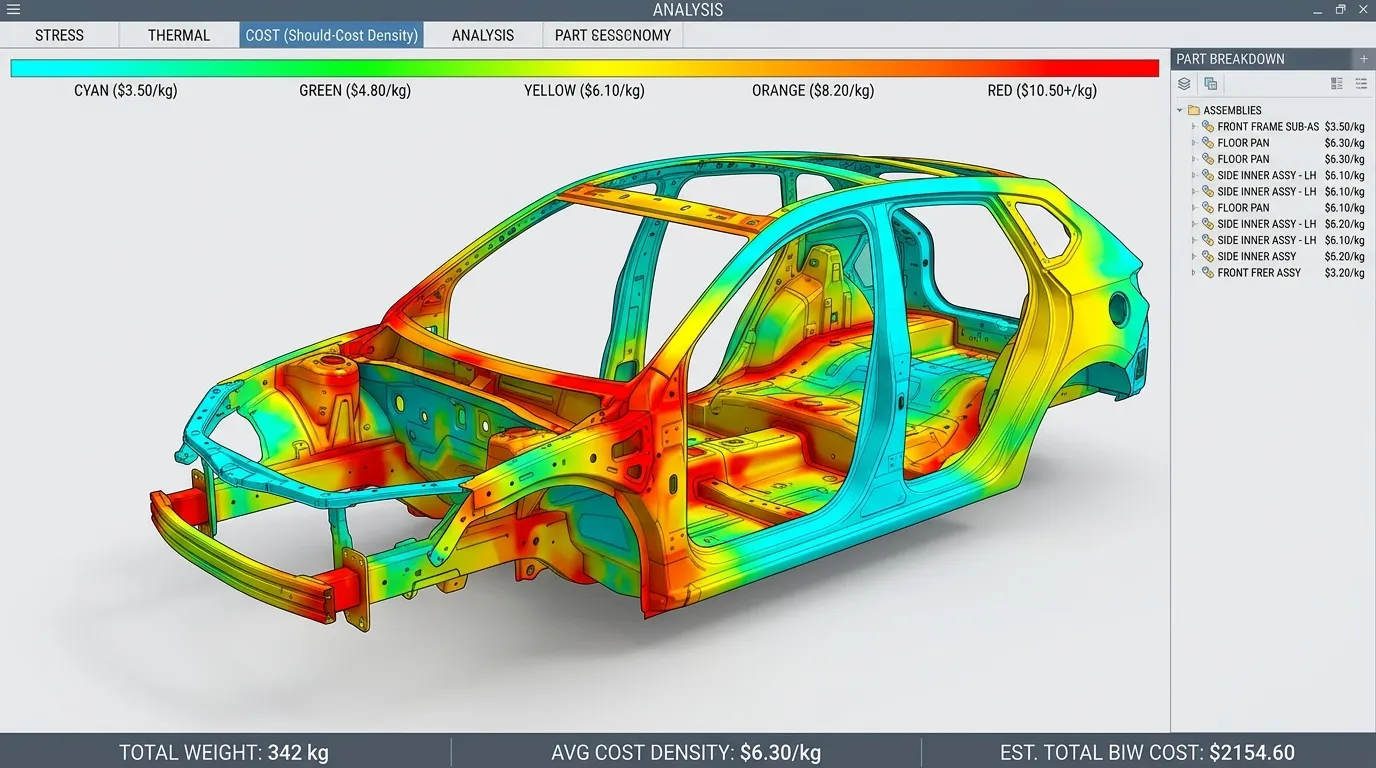
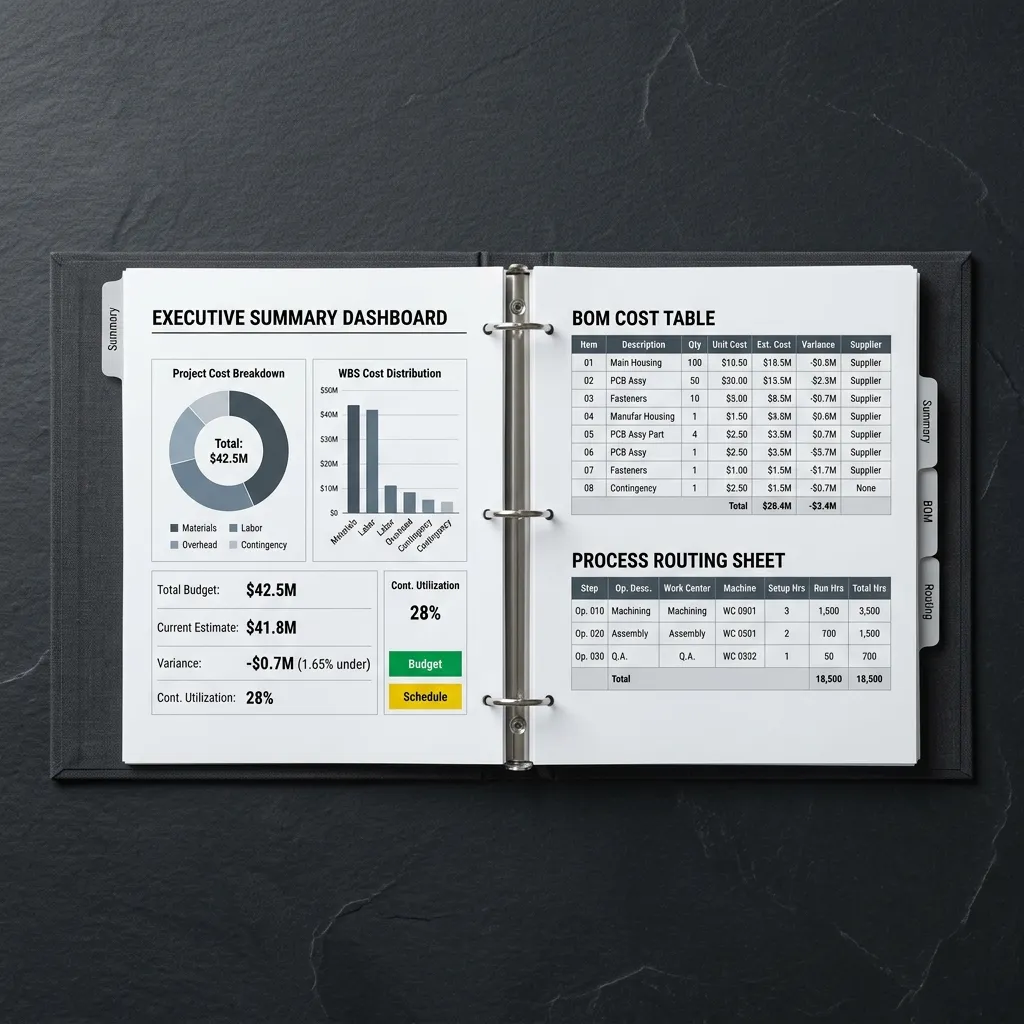
Interactive Report Dashboard
Comprehensive procurement audit packages delivering actionable fact-based negotiation ammunition.
Granular Cost Breakdown
Line-item visibility into raw material BOM pricing, machining feeds, machine hour amortization, and SG&A markups.
Pan-India Support & Execution Flow
Rapid cleanroom lab modeling coupled with portable on-site hardware scanning across India's industrial manufacturing hubs.
 IMAGE PLACEHOLDER // SECTION 6: Engineer presenting should-cost analysis in supplier meeting
What is Product Should-Cost Analysis Services India?
Competitive Benchmarking and Should-Costing is the structured physical disassembly, material identification, process cycle-time estimation, and bottom-up cost modeling of competitor products and vehicle subsystems.
When to Select This Service
Choose teardown and should-costing when seeking actionable VAVE cost-reduction roadmaps (typically 10%–25% savings), supplier quotation validations, or competitive product intelligence.
Technical Capabilities & Verification Standards
Verified engineering parameters, hardware precision, and compliance benchmarks applied across all deliverables.
| Engineering Parameter | APJ 3D Capability & Precision Range | Compliance Standard / Verification |
|---|---|---|
| Benchmarking Scope | Full Vehicle Teardown (EV/ICE), Subsystems, Powertrains, Battery Packs, Industrial Equipment, Home Appliances | Standardized AIAG / VAVE Protocols |
| Costing Methodology | Bottom-Up Should-Costing (Raw material + Cycle time + Machine rates + Tooling amortization + SG&A/Profit) | Global & Indian Cost Databases |
| Material Characterization | Spectroscopy (OES/XRF), Polymer FTIR, Hardness Testing, Tensile & Microstructure Evaluation | NABL Accredited Lab Verification |
| Deliverables | Teardown Photo Books, Digital Bill of Materials (BOM), Should-Cost Models (Excel), VAVE Idea Roadmaps, CAD Assemblies | Complete Digital Teardown Portals |
| Typical Cost Savings | 10% to 25% achievable component cost reduction through DFM/VAVE recommendations | High-ROI Engineering Insights |
| Facility Capability | Dedicated 15,000+ sq.ft. Secure Vehicle & Subsystem Teardown Bays in Hosur & Chennai | NDAs & High-Security Protocols |
| Turnaround Time | 1 to 3 weeks for subsystem teardown and comprehensive should-cost models | Turnkey Benchmarking Programs |
Frequently Asked Questions
What is included in a product teardown report?
What is included in a product teardown report?
How does should-costing help in supplier negotiations?
How does should-costing help in supplier negotiations?
What is VAVE and how do you generate savings ideas?
What is VAVE and how do you generate savings ideas?
Can you benchmark electric vehicle (EV) battery packs and powertrains?
Can you benchmark electric vehicle (EV) battery packs and powertrains?
How do you maintain confidentiality and intellectual property during teardowns?
How do you maintain confidentiality and intellectual property during teardowns?
Know the Real Manufacturing Cost Before You Negotiate
Our Product should-cost analysis services and Should cost modelling engineering provide indisputable BOM clarity. Partner with APJ 3D for comprehensive Product BOM cost analysis services to eliminate procurement guesswork and secure unfair negotiation advantage.