Automotive Subsystem & Component Benchmarking
Transform physical competitor vehicle hardware into high-fidelity digital engineering intelligence. Sub-millimeter 3D scanning, material identification, structural analysis, and parametric scan-to-CAD models across all vehicle subsystems.
The Engineering Blind Spot
You Cannot Design a Better System Without Knowing How the Best Systems Are Actually Built.
Vehicle Tear-Down Stratification
Hover over the architectural layers to explore specific benchmarking domains.
Deep-Dive Benchmarking Lab
Scroll horizontally to explore the physical teardown workstations.
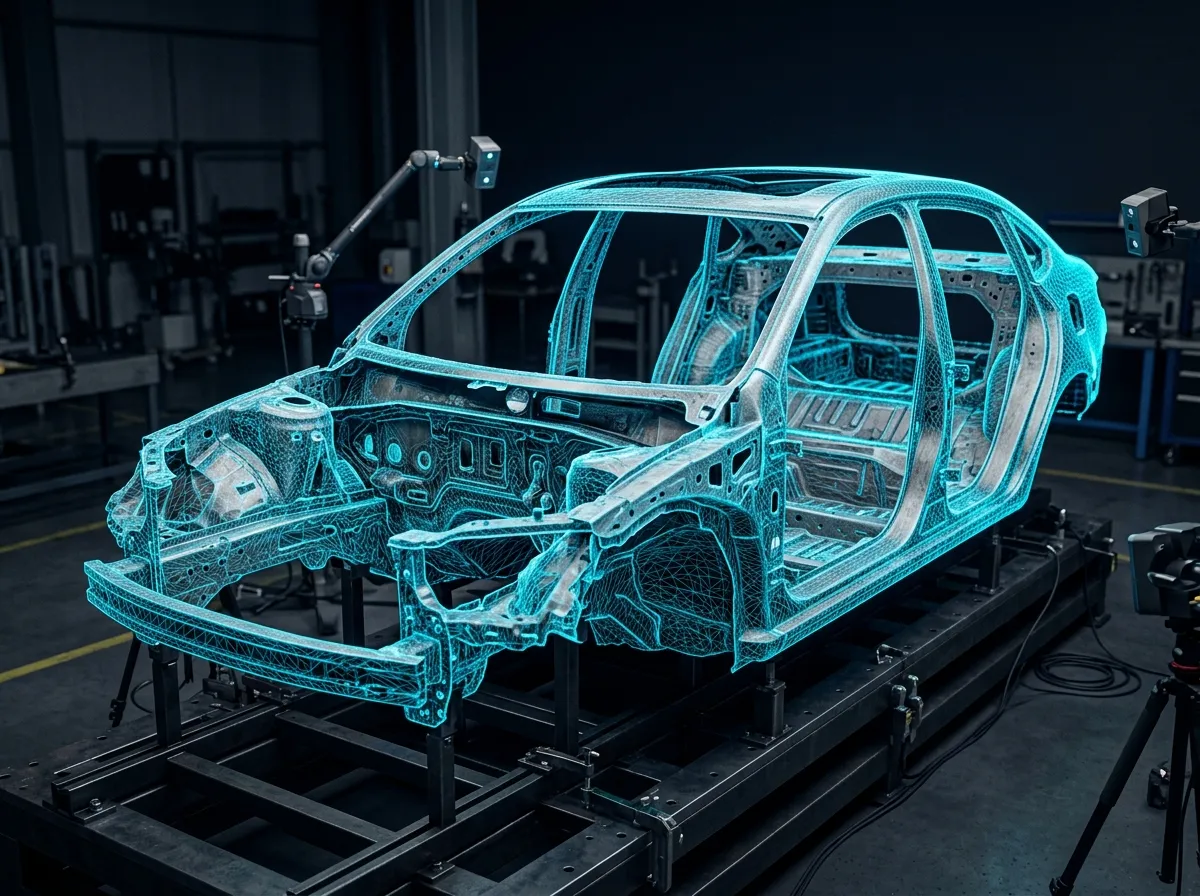
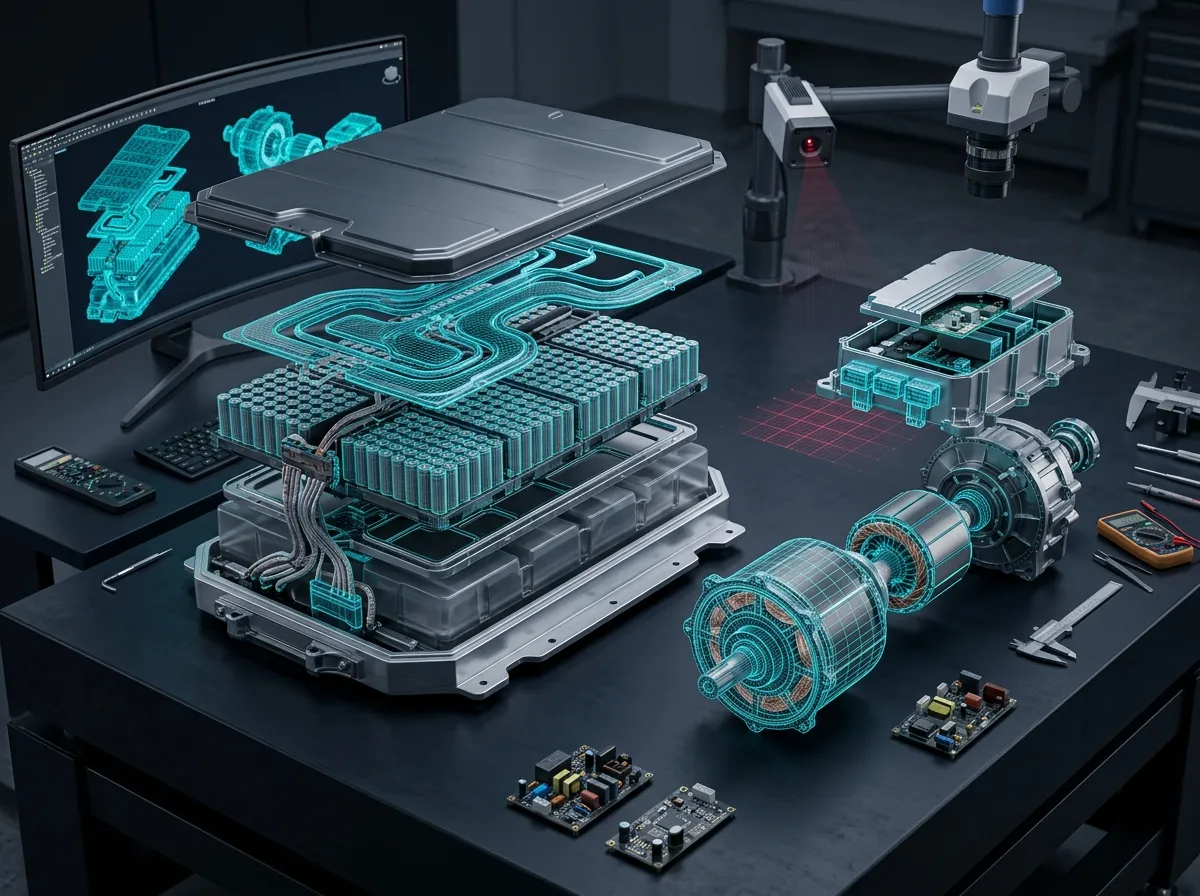

Scan-to-CAD Intelligence Pipeline
The journey from physical hardware to 3D Scanning Benchmarking and Engineering Comparison Reports.
1. Physical Teardown
Dismantling the actual subsystem.
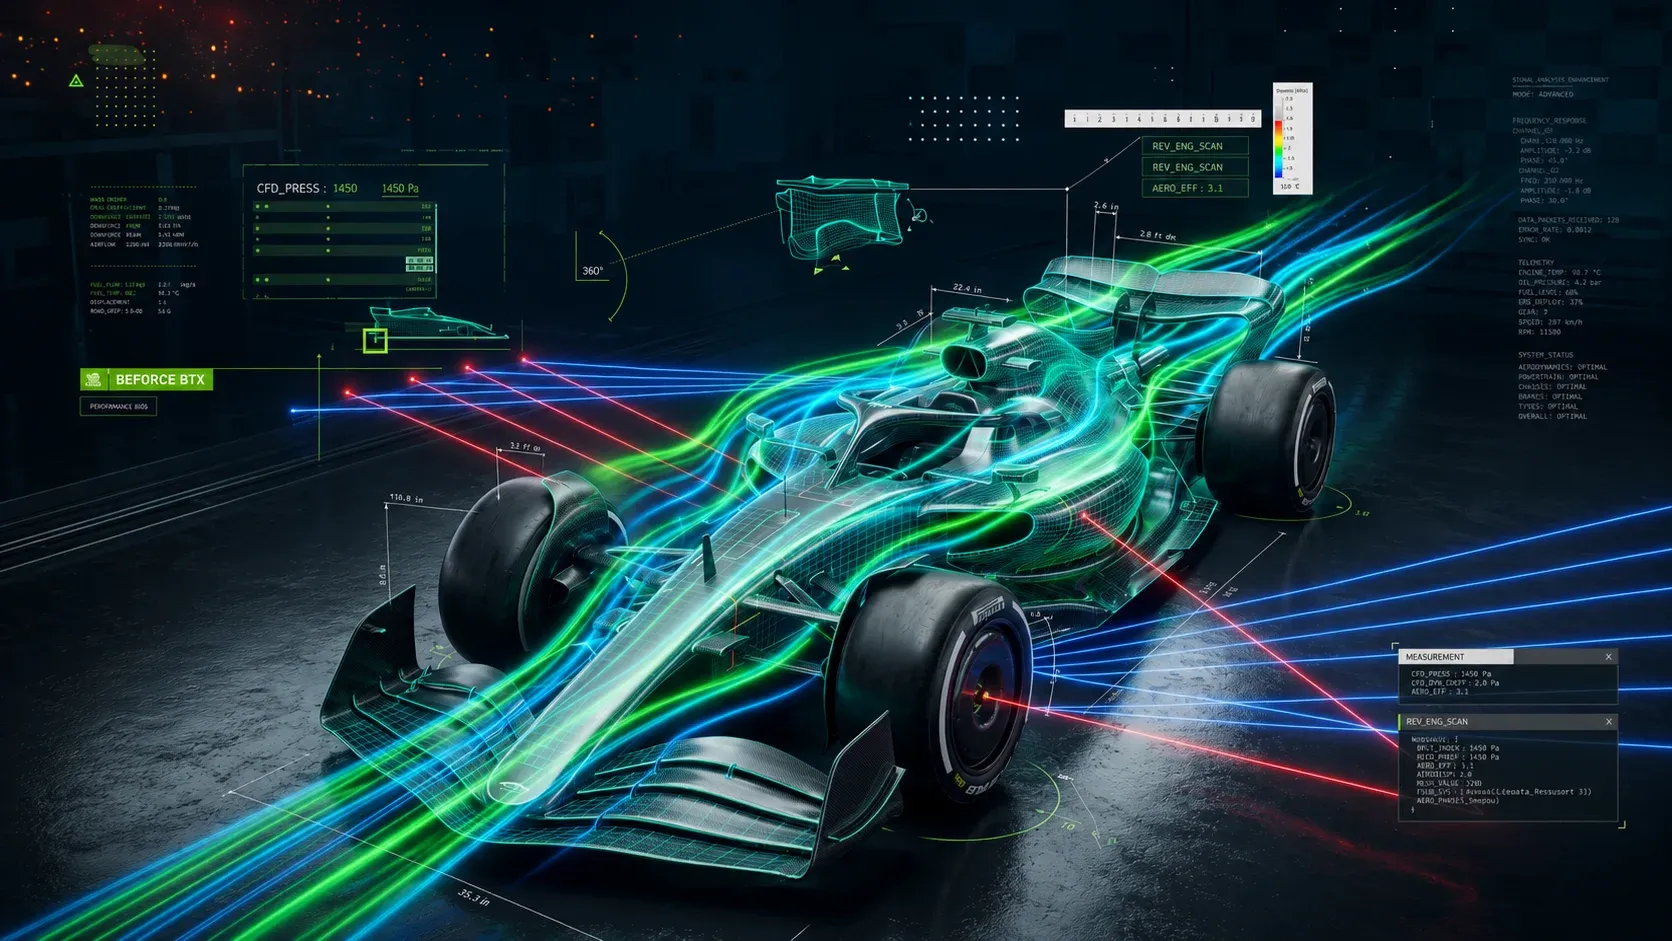
2. 3D Scanning
Blue-light scanner capturing geometry.
3. Point Cloud Generation
Dense scan mesh alignment.
4. CAD Reconstruction
Finished native engineering model.
5. Benchmarking Analysis
Deviation maps and actionable engineering intelligence.
Component Forensics Center
Floating intelligence panels connected to the exact geometric features they describe.
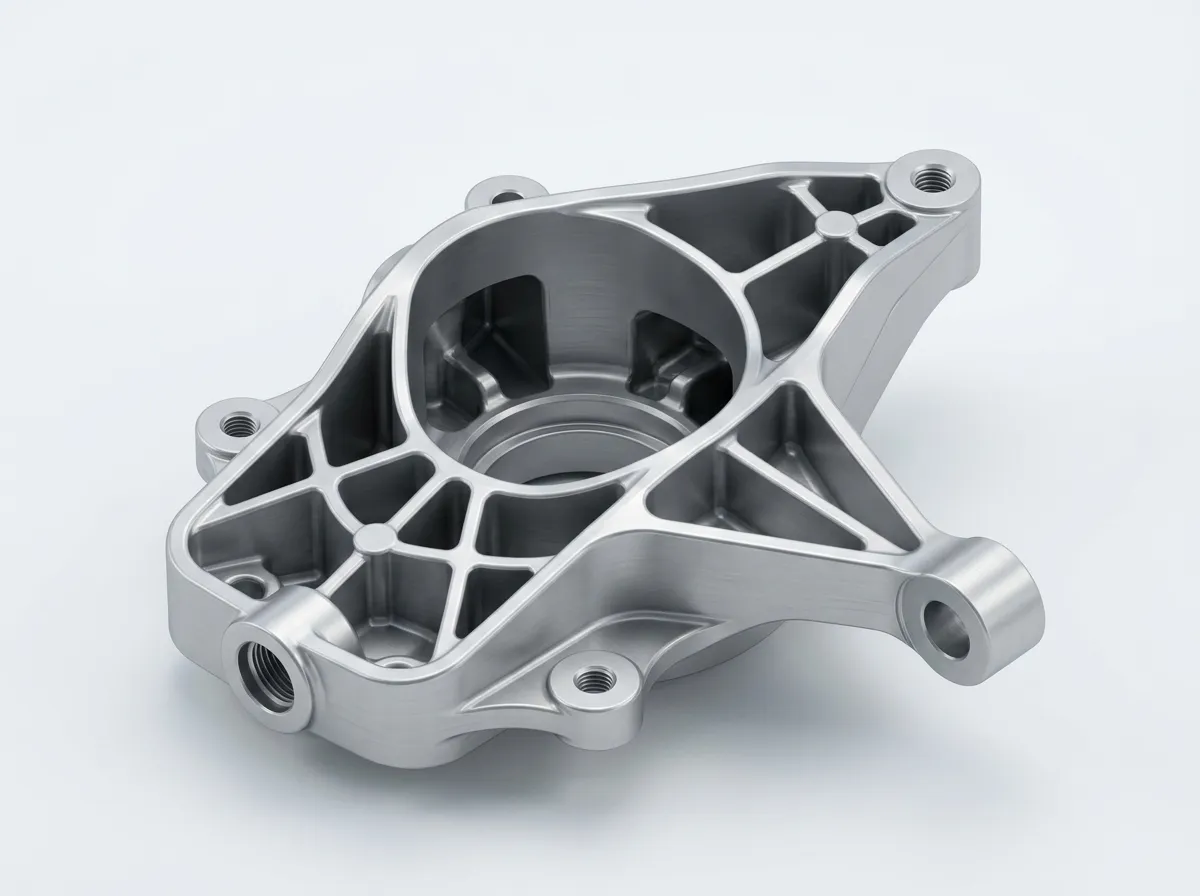
Weight Data
4.2 kg (12% heavier than Gen 1)Material Gauge
2.5mm High-Strength SteelManufacturing Method
High-Pressure Die CastingJoining Method
Structural Adhesive + SPRGeometry Analysis
Draft angles optimized for 45s cycleVAVE Insights
Potential to eliminate 3 fastenersEvidence-Based Benchmarking Dashboard
Why APJ 3D Benchmarking Programmes Are Different.
MEASURED
HARDWARE
SCAN
DATA
CAD
MODELS
ENGINEERING
REPORTS
PROGRAMME
DECISIONS
Physical Measurement First
We don't rely on assumptions. Every report is backed by CMM and 3D scan data.
Full Subsystem Coverage
From BIW structures to EV Powertrains and complex interior assemblies.
Scan-to-CAD Outputs
We deliver workable Native CAD (NX/CATIA), not just PDF reports.
VAVE Ready Intelligence
Immediate, actionable cost reduction opportunities highlighted.
Pan-India Deployment
Teams available for on-site teardown and scanning across India.
Strict NDA Compliance
Secure data transmission and total confidentiality for future models.
What is Automotive Subsystem and Component Benchmarking?
Competitive Benchmarking and Should-Costing is the structured physical disassembly, material identification, process cycle-time estimation, and bottom-up cost modeling of competitor products and vehicle subsystems.
When to Select This Service
Choose teardown and should-costing when seeking actionable VAVE cost-reduction roadmaps (typically 10%–25% savings), supplier quotation validations, or competitive product intelligence.
Technical Capabilities & Verification Standards
Verified engineering parameters, hardware precision, and compliance benchmarks applied across all deliverables.
| Engineering Parameter | APJ 3D Capability & Precision Range | Compliance Standard / Verification |
|---|---|---|
| Benchmarking Scope | Full Vehicle Teardown (EV/ICE), Subsystems, Powertrains, Battery Packs, Industrial Equipment, Home Appliances | Standardized AIAG / VAVE Protocols |
| Costing Methodology | Bottom-Up Should-Costing (Raw material + Cycle time + Machine rates + Tooling amortization + SG&A/Profit) | Global & Indian Cost Databases |
| Material Characterization | Spectroscopy (OES/XRF), Polymer FTIR, Hardness Testing, Tensile & Microstructure Evaluation | NABL Accredited Lab Verification |
| Deliverables | Teardown Photo Books, Digital Bill of Materials (BOM), Should-Cost Models (Excel), VAVE Idea Roadmaps, CAD Assemblies | Complete Digital Teardown Portals |
| Typical Cost Savings | 10% to 25% achievable component cost reduction through DFM/VAVE recommendations | High-ROI Engineering Insights |
| Facility Capability | Dedicated 15,000+ sq.ft. Secure Vehicle & Subsystem Teardown Bays in Hosur & Chennai | NDAs & High-Security Protocols |
| Turnaround Time | 1 to 3 weeks for subsystem teardown and comprehensive should-cost models | Turnkey Benchmarking Programs |
Frequently Asked Questions
What is included in a product teardown report?
What is included in a product teardown report?
How does should-costing help in supplier negotiations?
How does should-costing help in supplier negotiations?
What is VAVE and how do you generate savings ideas?
What is VAVE and how do you generate savings ideas?
Can you benchmark electric vehicle (EV) battery packs and powertrains?
Can you benchmark electric vehicle (EV) battery packs and powertrains?
How do you maintain confidentiality and intellectual property during teardowns?
How do you maintain confidentiality and intellectual property during teardowns?
Need Engineering Data for Competitor Parts?
From BIW Structures to Complex Assemblies — APJ 3D Delivers Accurate Subsystem Benchmarking and Scan-to-CAD Services Across India.